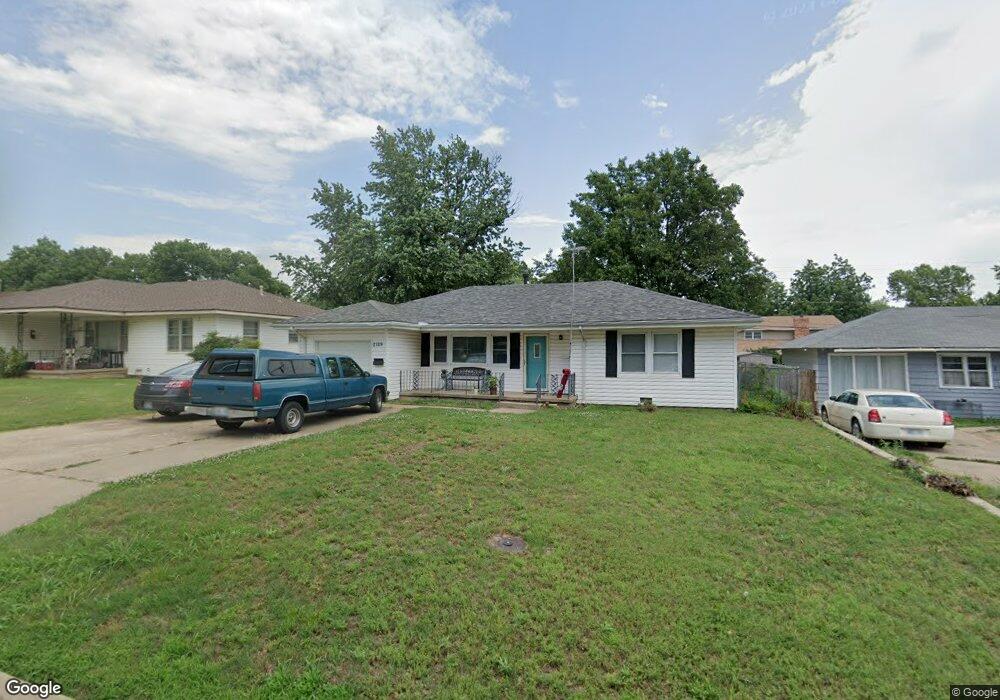
2129 Joe St Ponca City, OK 74601
Estimated Value: $123,000 - $130,458
3
Beds
2
Baths
1,320
Sq Ft
$96/Sq Ft
Est. Value
About This Home
This home is located at 2129 Joe St, Ponca City, OK 74601 and is currently estimated at $126,865, approximately $96 per square foot. 2129 Joe St is a home located in Kay County with nearby schools including E.M. Trout Elementary School, Ponca City East Middle School, and Ponca City West Middle School.
Ownership History
Date
Name
Owned For
Owner Type
Purchase Details
Closed on
Sep 17, 2019
Sold by
Vetter Sharla
Bought by
Welch Travis D and Welch Lisa R
Current Estimated Value
Home Financials for this Owner
Home Financials are based on the most recent Mortgage that was taken out on this home.
Original Mortgage
$64,000
Outstanding Balance
$42,443
Interest Rate
3.6%
Mortgage Type
New Conventional
Estimated Equity
$84,422
Purchase Details
Closed on
May 16, 2019
Sold by
Weng Hesheng and Weng Lijiao
Bought by
Vetter Sharla
Home Financials for this Owner
Home Financials are based on the most recent Mortgage that was taken out on this home.
Original Mortgage
$52,518
Interest Rate
4.1%
Mortgage Type
Purchase Money Mortgage
Purchase Details
Closed on
Aug 19, 2016
Sold by
Huddleston Kevin L
Bought by
Weng Hesheng and Weng Lijiao
Create a Home Valuation Report for This Property
The Home Valuation Report is an in-depth analysis detailing your home's value as well as a comparison with similar homes in the area
Home Values in the Area
Average Home Value in this Area
Purchase History
| Date | Buyer | Sale Price | Title Company |
|---|---|---|---|
| Welch Travis D | $80,000 | Security Title Service | |
| Vetter Sharla | $51,000 | Security Title Services | |
| Weng Hesheng | $65,000 | Security Title Service |
Source: Public Records
Mortgage History
| Date | Status | Borrower | Loan Amount |
|---|---|---|---|
| Open | Welch Travis D | $64,000 | |
| Previous Owner | Vetter Sharla | $52,518 |
Source: Public Records
Tax History Compared to Growth
Tax History
| Year | Tax Paid | Tax Assessment Tax Assessment Total Assessment is a certain percentage of the fair market value that is determined by local assessors to be the total taxable value of land and additions on the property. | Land | Improvement |
|---|---|---|---|---|
| 2024 | $789 | $9,335 | $950 | $8,385 |
| 2023 | $789 | $9,064 | $950 | $8,114 |
| 2022 | $742 | $8,800 | $950 | $7,850 |
| 2021 | $746 | $8,800 | $950 | $7,850 |
| 2020 | $833 | $8,800 | $950 | $7,850 |
| 2019 | $667 | $6,984 | $950 | $6,034 |
| 2018 | $666 | $6,880 | $950 | $5,930 |
| 2017 | $701 | $7,150 | $950 | $6,200 |
| 2016 | $490 | $4,946 | $594 | $4,352 |
| 2015 | $483 | $4,852 | $594 | $4,258 |
| 2014 | $465 | $4,760 | $594 | $4,166 |
Source: Public Records
Map
Nearby Homes
- 3651 N 14th St
- TBD 5th and Windsor
- 2000 N 5th St
- 2005 N 4th St
- 1128 N 14th St
- 1412 Donahoe Dr
- 1600 Monument Rd
- 2612 Meadow Ln
- 113 E Fresno Ave
- 0000 N Union St
- 734 E Albany Ave
- 304 E Detroit Ave
- 1413 Crawford Ave
- 1013 N 7th St
- 2223 Turner St
- 120 E Woodbury Rd
- 2208 El Camino St
- 2216 El Camino St
- 121 Hillside Ave
- 3019 Meadow Ln