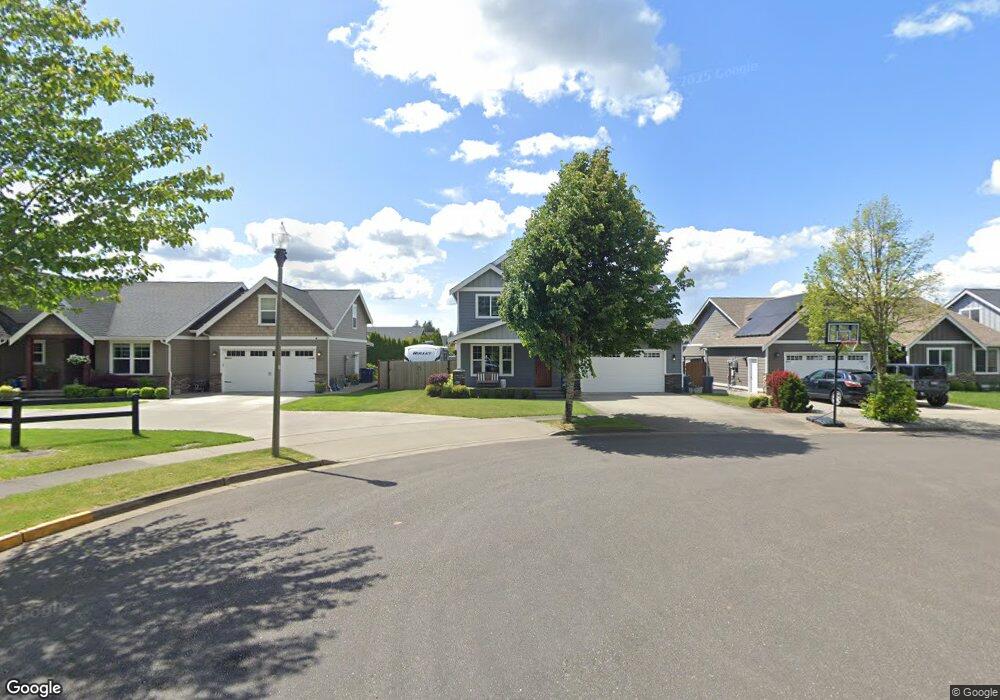
2129 Littlefield Ct Lynden, WA 98264
Estimated Value: $691,616 - $741,000
3
Beds
3
Baths
1,977
Sq Ft
$359/Sq Ft
Est. Value
About This Home
This home is located at 2129 Littlefield Ct, Lynden, WA 98264 and is currently estimated at $708,904, approximately $358 per square foot. 2129 Littlefield Ct is a home with nearby schools including Lynden High School, Cornerstone Christian School, and Covenant Christian School.
Ownership History
Date
Name
Owned For
Owner Type
Purchase Details
Closed on
Aug 26, 2013
Sold by
Wiersma Construction Inc
Bought by
Presley Jason and Presley Jennifer
Current Estimated Value
Home Financials for this Owner
Home Financials are based on the most recent Mortgage that was taken out on this home.
Original Mortgage
$252,000
Outstanding Balance
$187,079
Interest Rate
4.27%
Mortgage Type
New Conventional
Estimated Equity
$521,825
Purchase Details
Closed on
May 14, 2013
Sold by
Np Phase 1 Llc
Bought by
Wiersma Construction Inc
Home Financials for this Owner
Home Financials are based on the most recent Mortgage that was taken out on this home.
Original Mortgage
$236,000
Interest Rate
3.5%
Mortgage Type
Construction
Create a Home Valuation Report for This Property
The Home Valuation Report is an in-depth analysis detailing your home's value as well as a comparison with similar homes in the area
Home Values in the Area
Average Home Value in this Area
Purchase History
| Date | Buyer | Sale Price | Title Company |
|---|---|---|---|
| Presley Jason | $315,280 | Chicago Title Insurance | |
| Wiersma Construction Inc | $82,280 | Chicago Title Insurance |
Source: Public Records
Mortgage History
| Date | Status | Borrower | Loan Amount |
|---|---|---|---|
| Open | Presley Jason | $252,000 | |
| Previous Owner | Wiersma Construction Inc | $236,000 |
Source: Public Records
Tax History Compared to Growth
Tax History
| Year | Tax Paid | Tax Assessment Tax Assessment Total Assessment is a certain percentage of the fair market value that is determined by local assessors to be the total taxable value of land and additions on the property. | Land | Improvement |
|---|---|---|---|---|
| 2024 | $4,520 | $636,372 | $242,500 | $393,872 |
| 2023 | $4,520 | $628,723 | $250,000 | $378,723 |
| 2022 | $4,579 | $600,764 | $144,408 | $456,356 |
| 2021 | $4,491 | $496,493 | $119,344 | $377,149 |
| 2020 | $3,934 | $443,310 | $106,560 | $336,750 |
| 2019 | $3,501 | $406,527 | $97,840 | $308,687 |
| 2018 | $3,826 | $370,789 | $89,128 | $281,661 |
| 2017 | $3,203 | $332,815 | $80,000 | $252,815 |
| 2016 | $3,016 | $296,348 | $68,200 | $228,148 |
| 2015 | $2,674 | $277,470 | $65,596 | $211,874 |
| 2014 | -- | $268,073 | $63,364 | $204,709 |
| 2013 | -- | $266,709 | $62,000 | $204,709 |
Source: Public Records
Map
Nearby Homes
- 2202 Berryman Loop
- 1725 Aaron Dr
- 2021 Brome St
- 2029 Brome St
- 8885 Line Rd
- 8865 Northwood Rd
- 2014 Monteview Ct
- 2201 Dejong Dr
- 2205 Dejong Dr
- 2105 Lagerwey Cir
- 2103 Lagerwey Cir
- 2163 Lagerwey Cir
- 1792 Bradley Rd
- 1660 Eastwood Way
- 1402 Bradley Meadows Ln
- 2080 Bowfin Way
- 1319 Bradley Ct
- 1136 N Cascade Ct
- 1112 N Cascade Ct
- 1251 Garden Cir
- 2117 Littlefield Ct
- 2141 Littlefield Ct
- 2126 Shea St
- 2138 Shea St
- 2114 Shea St
- 2153 Littlefield Ct
- 2103 Littlefield Ct
- 2150 Shea St
- 2165 Littlefield Ct
- 2102 Shea St
- 2146 Littlefield Ct
- 2134 Littlefield Ct
- 2162 Shea St
- 2158 Littlefield Ct
- 2177 Littlefield Ct
- 2125 Shea St
- 2137 Shea St
- 2113 Shea St
- 2174 Shea St
- 2170 Littlefield Ct