Estimated Value: $556,000 - $622,853
3
Beds
3
Baths
2,766
Sq Ft
$210/Sq Ft
Est. Value
About This Home
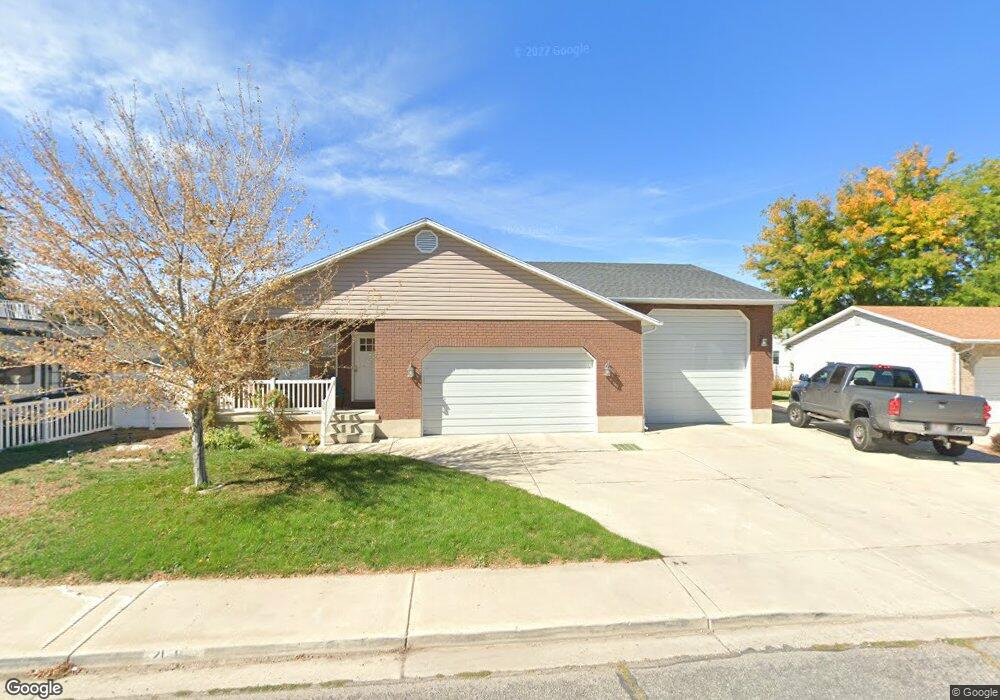
This home is located at 2129 N 600 W, Lehi, UT 84043 and is currently estimated at $581,463, approximately $210 per square foot. 2129 N 600 W is a home located in Utah County with nearby schools including Fox Hollow Elementary School and Skyridge High School.
Ownership History
Date
Name
Owned For
Owner Type
Purchase Details
Closed on
Sep 28, 2018
Sold by
Stout Wesley R and Stout Marianne A
Bought by
Strasburg Scott H
Current Estimated Value
Home Financials for this Owner
Home Financials are based on the most recent Mortgage that was taken out on this home.
Original Mortgage
$335,523
Outstanding Balance
$292,596
Interest Rate
4.5%
Mortgage Type
New Conventional
Estimated Equity
$288,867
Purchase Details
Closed on
Sep 21, 2005
Sold by
Shoell Wayne
Bought by
Stout Wesley R and Stout Marianne A
Home Financials for this Owner
Home Financials are based on the most recent Mortgage that was taken out on this home.
Original Mortgage
$154,800
Interest Rate
5.81%
Mortgage Type
Fannie Mae Freddie Mac
Purchase Details
Closed on
Jul 25, 1996
Sold by
Elton William T and Elton Janie Laverne
Bought by
Shoell Howard B
Home Financials for this Owner
Home Financials are based on the most recent Mortgage that was taken out on this home.
Original Mortgage
$97,028
Interest Rate
8.39%
Mortgage Type
Seller Take Back
Create a Home Valuation Report for This Property
The Home Valuation Report is an in-depth analysis detailing your home's value as well as a comparison with similar homes in the area
Home Values in the Area
Average Home Value in this Area
Purchase History
| Date | Buyer | Sale Price | Title Company |
|---|---|---|---|
| Strasburg Scott H | -- | Access Title Co | |
| Stout Wesley R | -- | -- | |
| Shoell Howard B | -- | Provo Abstract Co |
Source: Public Records
Mortgage History
| Date | Status | Borrower | Loan Amount |
|---|---|---|---|
| Open | Strasburg Scott H | $335,523 | |
| Previous Owner | Stout Wesley R | $154,800 | |
| Previous Owner | Shoell Howard B | $97,028 |
Source: Public Records
Tax History Compared to Growth
Tax History
| Year | Tax Paid | Tax Assessment Tax Assessment Total Assessment is a certain percentage of the fair market value that is determined by local assessors to be the total taxable value of land and additions on the property. | Land | Improvement |
|---|---|---|---|---|
| 2025 | $2,356 | $316,965 | $193,800 | $382,500 |
| 2024 | $2,356 | $275,660 | $0 | $0 |
| 2023 | $2,186 | $277,805 | $0 | $0 |
| 2022 | $2,398 | $295,405 | $0 | $0 |
| 2021 | $2,167 | $403,600 | $112,100 | $291,500 |
| 2020 | $2,044 | $376,200 | $103,800 | $272,400 |
| 2019 | $1,840 | $352,200 | $103,800 | $248,400 |
| 2018 | $1,788 | $323,500 | $94,600 | $228,900 |
| 2017 | $1,704 | $163,845 | $0 | $0 |
| 2016 | $1,647 | $147,015 | $0 | $0 |
| 2015 | $1,708 | $144,705 | $0 | $0 |
| 2014 | $1,551 | $130,625 | $0 | $0 |
Source: Public Records
Map
Nearby Homes
- 497 W 2200 N
- 497 W 2280 N
- 2287 N 750 W
- 1011 W Mountain Way Unit 316
- 1755 N 250 W
- 1817 W Bad Rock Cir
- 902 W 1500 N
- 804 W 2700 N
- 1610 N 1125 W
- 2687 N 900 W
- 1272 W 1800 N
- 1249 W 1800 N
- 1094 W 1425 N
- 192 E 2200 N
- 4333 N Baiken Ridge Dr Unit 1020
- 1301 N 900 W Unit 12
- 1332 W 1500 N
- 2946 N 1080 W
- 2539 N 300 E
- 1155 W 2980 N