2129 NE Spring Creek Palm Bay, FL 32905
Port Malabar NeighborhoodEstimated Value: $319,537 - $345,000
3
Beds
2
Baths
1,865
Sq Ft
$177/Sq Ft
Est. Value
About This Home
This home is located at 2129 NE Spring Creek, Palm Bay, FL 32905 and is currently estimated at $330,884, approximately $177 per square foot. 2129 NE Spring Creek is a home located in Brevard County with nearby schools including Palm Bay Elementary School, Stone Magnet Middle School, and Palm Bay Magnet Senior High School.
Ownership History
Date
Name
Owned For
Owner Type
Purchase Details
Closed on
Jan 31, 2019
Sold by
Olomu Francis A
Bought by
Semenec Michelle L
Current Estimated Value
Purchase Details
Closed on
Aug 24, 2011
Sold by
Donovan Shaun
Bought by
Olomu Francis A
Purchase Details
Closed on
Nov 22, 2010
Sold by
Wells Fargo Bank Na
Bought by
Secretary Of Housing & Urban Development
Purchase Details
Closed on
Sep 29, 2008
Sold by
Goodrich Jerry A
Bought by
Winslow Joseph W
Home Financials for this Owner
Home Financials are based on the most recent Mortgage that was taken out on this home.
Original Mortgage
$173,280
Interest Rate
6.45%
Purchase Details
Closed on
Aug 27, 2002
Sold by
Maronda Homes Inc Fl
Bought by
Goodrich Jerry A and Goodrich Gayle A
Home Financials for this Owner
Home Financials are based on the most recent Mortgage that was taken out on this home.
Original Mortgage
$53,550
Interest Rate
6.49%
Mortgage Type
Purchase Money Mortgage
Create a Home Valuation Report for This Property
The Home Valuation Report is an in-depth analysis detailing your home's value as well as a comparison with similar homes in the area
Home Values in the Area
Average Home Value in this Area
Purchase History
| Date | Buyer | Sale Price | Title Company |
|---|---|---|---|
| Semenec Michelle L | -- | None Available | |
| Olomu Francis A | $92,000 | Lawyers Advantage Title Grou | |
| Secretary Of Housing & Urban Development | -- | New House Title Llc | |
| Winslow Joseph W | $176,000 | State Title Partners Llp | |
| Goodrich Jerry A | -- | -- | |
| Goodrich Jerry A | $123,600 | -- |
Source: Public Records
Mortgage History
| Date | Status | Borrower | Loan Amount |
|---|---|---|---|
| Previous Owner | Winslow Joseph W | $173,280 | |
| Previous Owner | Goodrich Jerry A | $53,550 |
Source: Public Records
Tax History Compared to Growth
Tax History
| Year | Tax Paid | Tax Assessment Tax Assessment Total Assessment is a certain percentage of the fair market value that is determined by local assessors to be the total taxable value of land and additions on the property. | Land | Improvement |
|---|---|---|---|---|
| 2025 | $2,941 | $204,580 | -- | -- |
| 2024 | $2,871 | $198,820 | -- | -- |
| 2023 | $2,871 | $193,030 | $0 | $0 |
| 2022 | $2,764 | $187,410 | $0 | $0 |
| 2021 | $2,830 | $181,960 | $0 | $0 |
| 2020 | $2,774 | $179,450 | $22,000 | $157,450 |
| 2019 | $3,682 | $175,260 | $22,000 | $153,260 |
| 2018 | $3,413 | $169,640 | $22,000 | $147,640 |
| 2017 | $3,294 | $158,270 | $22,000 | $136,270 |
| 2016 | $2,958 | $148,780 | $22,000 | $126,780 |
| 2015 | $2,727 | $115,550 | $22,000 | $93,550 |
| 2014 | $2,508 | $105,050 | $22,000 | $83,050 |
Source: Public Records
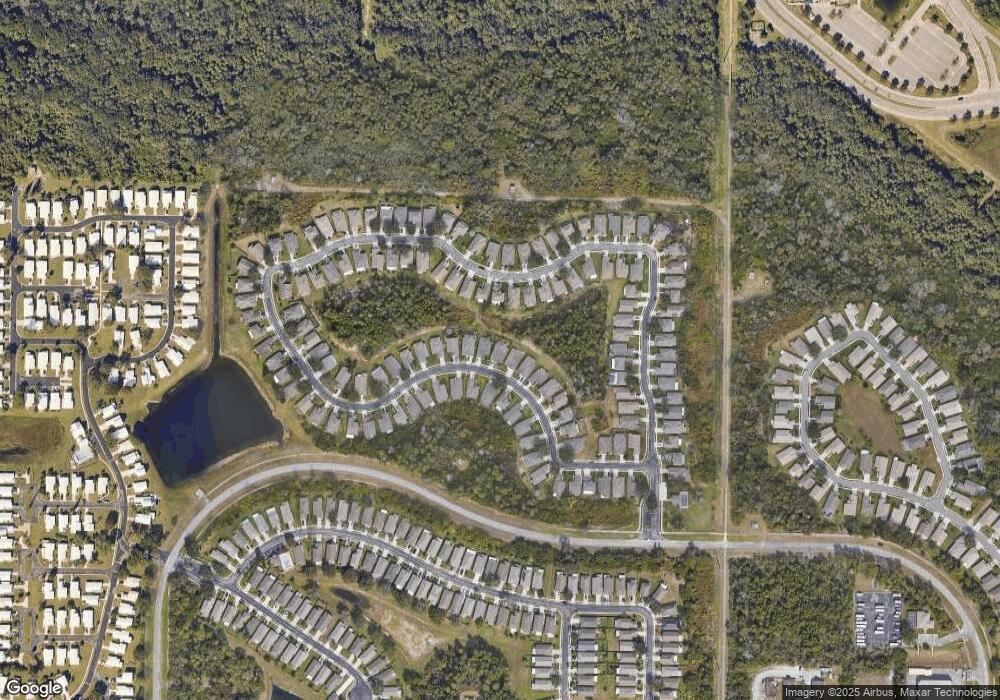
Map
Nearby Homes
- 2221 Spring Creek Cir NE
- 2210 Spring Creek Cir NE
- 2268 Spring Creek Cir NE
- 2183 Spring Creek Cir NE
- 2188 Redwood Cir NE
- 1112 Pine Creek Cir NE
- 1007 Pine Creek Cir NE
- 2035 Marlberry Ct NE
- 1125 Goldenrod Cir NE
- 1190 Pine Creek Cir NE
- 1941 Myrtle Ct NE
- 2163 Advana St NE
- 1196 Goldenrod Cir NE
- 1924 Elderberry Ct NE
- 918 Pine Creek Cir NE
- 1085 Clearmont St NE
- 2101 Gunpowder Dr NE
- 853 Knecht Rd NE
- 1247 van Tassell Trail NE
- 1238 Port Malabar Blvd NE
- 2129 Spring Creek Cir NE
- 2127 Spring Creek Cir NE
- 2131 NE Spring Creek
- 2131 Spring Creek Cir NE
- 2133 Spring Creek Cir NE
- 2124 Spring Creek Cir NE
- 2126 NE Spring Creek
- 2126 Spring Creek Cir NE
- 2123 Spring Creek Cir NE
- 2135 Spring Creek Cir NE
- 2128 Spring Creek Cir NE
- 2209 Spring Creek Cir NE
- 2211 Spring Creek Cir NE
- 2207 Spring Creek Cir NE
- 2120 Spring Creek Cir NE
- 2121 Spring Creek Cir NE
- 2137 Spring Creek Cir NE
- 2215 Spring Creek Cir NE
- 2130 Spring Creek Cir NE
- 2205 Spring Creek Cir NE