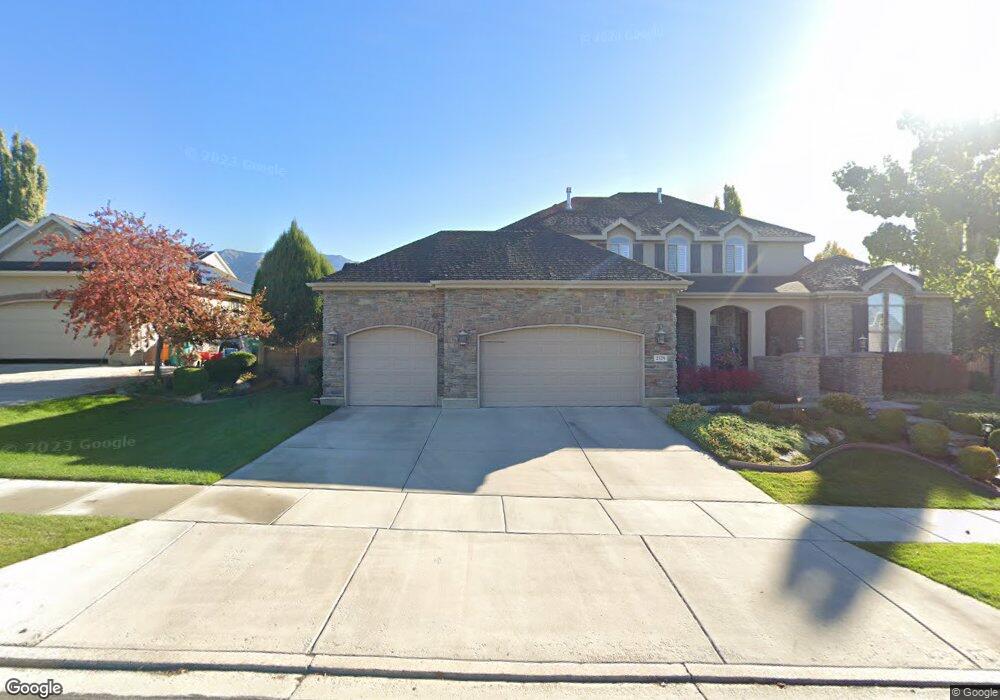
2129 S 100 W Orem, UT 84058
Lakeview NeighborhoodEstimated Value: $985,000 - $1,283,000
6
Beds
4
Baths
5,322
Sq Ft
$209/Sq Ft
Est. Value
About This Home
This home is located at 2129 S 100 W, Orem, UT 84058 and is currently estimated at $1,113,805, approximately $209 per square foot. 2129 S 100 W is a home located in Utah County with nearby schools including Cherry Hill Elementary School, Lakeridge Jr High School, and Mountain View High School.
Ownership History
Date
Name
Owned For
Owner Type
Purchase Details
Closed on
Jun 1, 2015
Sold by
Jenkins David Paul and Jenkins Jacqueline Denise
Bought by
Palmer Dustin and Palmer Amy
Current Estimated Value
Home Financials for this Owner
Home Financials are based on the most recent Mortgage that was taken out on this home.
Original Mortgage
$400,000
Outstanding Balance
$308,589
Interest Rate
3.64%
Mortgage Type
New Conventional
Estimated Equity
$805,216
Purchase Details
Closed on
Jan 25, 2007
Sold by
Ivory Homes Ltd
Bought by
Jenkins David P and Jenkins Jacqueline D
Home Financials for this Owner
Home Financials are based on the most recent Mortgage that was taken out on this home.
Original Mortgage
$277,000
Interest Rate
6.1%
Mortgage Type
New Conventional
Create a Home Valuation Report for This Property
The Home Valuation Report is an in-depth analysis detailing your home's value as well as a comparison with similar homes in the area
Home Values in the Area
Average Home Value in this Area
Purchase History
| Date | Buyer | Sale Price | Title Company |
|---|---|---|---|
| Palmer Dustin | -- | Access Title Co | |
| Jenkins David P | -- | Cottonwood Title | |
| Ivory Homes Ltd | -- | Cottonwood Title |
Source: Public Records
Mortgage History
| Date | Status | Borrower | Loan Amount |
|---|---|---|---|
| Open | Palmer Dustin | $400,000 | |
| Previous Owner | Jenkins David P | $277,000 |
Source: Public Records
Tax History
| Year | Tax Paid | Tax Assessment Tax Assessment Total Assessment is a certain percentage of the fair market value that is determined by local assessors to be the total taxable value of land and additions on the property. | Land | Improvement |
|---|---|---|---|---|
| 2025 | $4,185 | $508,970 | -- | -- |
| 2024 | $4,185 | $511,720 | $0 | $0 |
| 2023 | $4,017 | $527,890 | $0 | $0 |
| 2022 | $4,801 | $611,325 | $0 | $0 |
| 2021 | $4,373 | $843,400 | $217,200 | $626,200 |
| 2020 | $4,143 | $785,300 | $188,900 | $596,400 |
| 2019 | $3,515 | $692,800 | $188,900 | $503,900 |
| 2018 | $3,483 | $655,900 | $188,900 | $467,000 |
| 2017 | $3,514 | $354,530 | $0 | $0 |
| 2016 | $3,451 | $321,035 | $0 | $0 |
| 2015 | $3,318 | $291,885 | $0 | $0 |
| 2014 | $2,782 | $243,650 | $0 | $0 |
Source: Public Records
Map
Nearby Homes
- 2141 S 100 W
- 2111 S 100 W
- 2136 S 60 W
- 2130 S 60 W Unit 22
- 2132 S 100 W
- 2142 S 60 W Unit 24
- 2144 S 100 W Unit 202
- 2118 S 60 W
- 2118 S 60 W Unit 21
- 2157 S 100 W
- 2103 S 100 W
- 70 W 2170 S
- 2158 S 100 W
- 2104 S 60 W Unit 20
- 2106 S 100 W
- 2125 S 140 W
- 2125 S 140 W Unit 107
- 2135 S 60 W
- 2145 S 140 W
- 2129 S 60 W
Your Personal Tour Guide
Ask me questions while you tour the home.