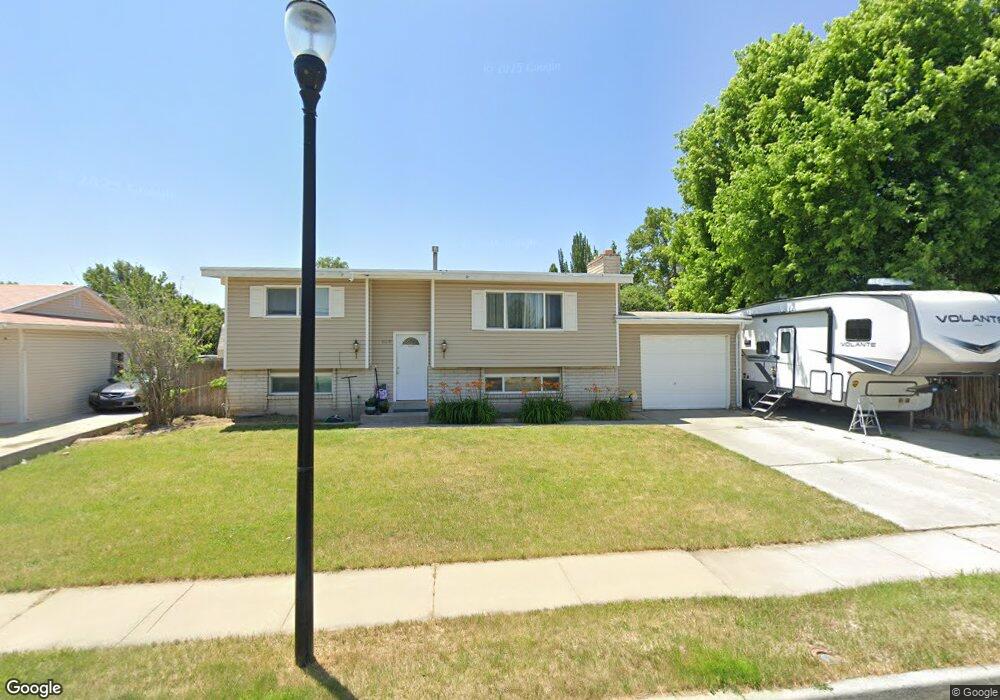
2129 W 7380 S West Jordan, UT 84084
Estimated Value: $436,000 - $487,392
4
Beds
2
Baths
1,812
Sq Ft
$255/Sq Ft
Est. Value
About This Home
This home is located at 2129 W 7380 S, West Jordan, UT 84084 and is currently estimated at $461,848, approximately $254 per square foot. 2129 W 7380 S is a home located in Salt Lake County with nearby schools including Majestic Elementary Arts Academy, West Jordan Middle School, and West Jordan High School.
Ownership History
Date
Name
Owned For
Owner Type
Purchase Details
Closed on
Jul 30, 2013
Sold by
White Dennis L and White Gwen V
Bought by
White Lauranna
Current Estimated Value
Purchase Details
Closed on
Jul 5, 2006
Sold by
Nebeker Jim and Nebeker Kiersten
Bought by
White Dennis L and White Gwen
Home Financials for this Owner
Home Financials are based on the most recent Mortgage that was taken out on this home.
Original Mortgage
$100,000
Outstanding Balance
$59,302
Interest Rate
6.63%
Mortgage Type
Purchase Money Mortgage
Estimated Equity
$402,546
Purchase Details
Closed on
Feb 28, 2001
Sold by
Page Clyde V
Bought by
Nebeker Jim and Nebeker Kiersten
Home Financials for this Owner
Home Financials are based on the most recent Mortgage that was taken out on this home.
Original Mortgage
$112,076
Interest Rate
6.98%
Mortgage Type
FHA
Create a Home Valuation Report for This Property
The Home Valuation Report is an in-depth analysis detailing your home's value as well as a comparison with similar homes in the area
Home Values in the Area
Average Home Value in this Area
Purchase History
| Date | Buyer | Sale Price | Title Company |
|---|---|---|---|
| White Lauranna | -- | None Available | |
| White Dennis L | -- | Us Title Of Utah | |
| Nebeker Jim | -- | Backman Stewart Title Servic |
Source: Public Records
Mortgage History
| Date | Status | Borrower | Loan Amount |
|---|---|---|---|
| Open | White Dennis L | $100,000 | |
| Previous Owner | Nebeker Jim | $112,076 |
Source: Public Records
Tax History Compared to Growth
Tax History
| Year | Tax Paid | Tax Assessment Tax Assessment Total Assessment is a certain percentage of the fair market value that is determined by local assessors to be the total taxable value of land and additions on the property. | Land | Improvement |
|---|---|---|---|---|
| 2025 | $2,244 | $449,400 | $133,100 | $316,300 |
| 2024 | $2,244 | $431,800 | $128,400 | $303,400 |
| 2023 | $2,173 | $394,100 | $122,300 | $271,800 |
| 2022 | $2,255 | $402,300 | $119,900 | $282,400 |
| 2021 | $1,890 | $307,000 | $97,800 | $209,200 |
| 2020 | $1,803 | $274,800 | $97,800 | $177,000 |
| 2019 | $1,815 | $271,300 | $97,800 | $173,500 |
| 2018 | $1,544 | $228,900 | $73,800 | $155,100 |
| 2017 | $1,435 | $211,800 | $73,800 | $138,000 |
| 2016 | $1,370 | $189,900 | $73,800 | $116,100 |
| 2015 | $1,391 | $188,100 | $84,400 | $103,700 |
| 2014 | $1,333 | $177,400 | $80,300 | $97,100 |
Source: Public Records
Map
Nearby Homes
- 2169 W 7600 S
- 7645 S 1960 W
- 7279 S Kenadi Ct
- 2062 W 7705 S
- 7150 Camelot Way
- 1951 W 7125 S
- 7149 S Camelot Way
- 1817 W 7600 S Unit I204
- 2510 W Jordan Meadows Ln
- 1718 W Trey Way Unit 2
- 1829 W 7600 S Unit G301
- 2312 W Hidden Bend Cove Unit 107
- 2386 W 7680 S
- 1801 W 7600 S Unit C201
- 2573 Jordan Meadows Ln
- 1805 W 7600 S Unit D204
- 7647 S 2500 W
- 1678 Leland Dr
- 7361 S 2700 W
- 7693 S Redwood Rd