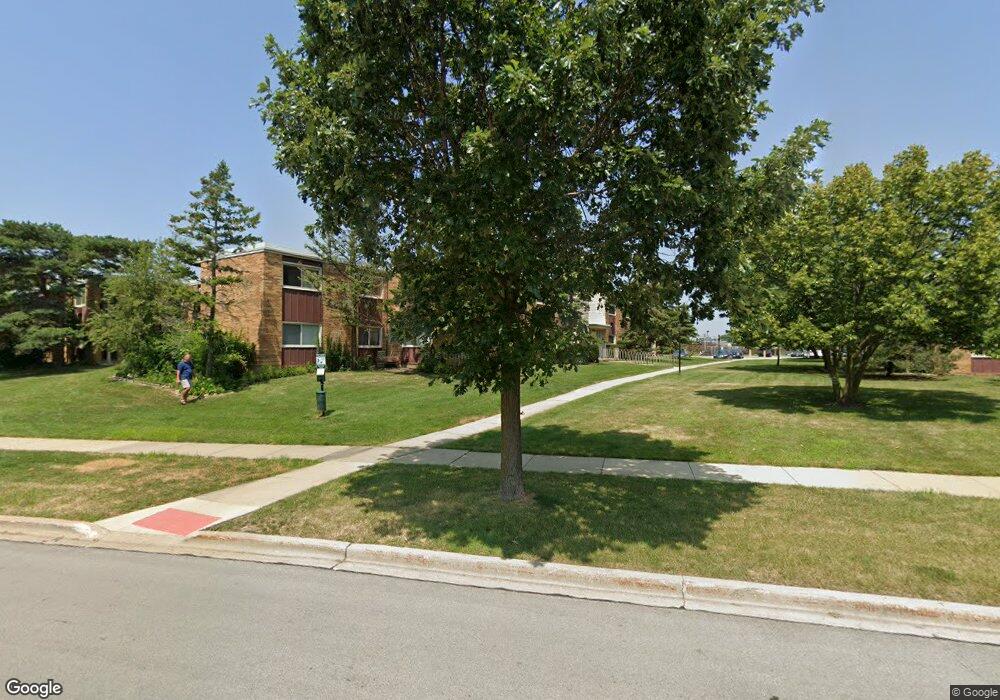
212B Collen Dr Unit 3/114 Lombard, IL 60148
South Lombard NeighborhoodEstimated Value: $171,000 - $238,000
--
Bed
--
Bath
1,092
Sq Ft
$176/Sq Ft
Est. Value
About This Home
This home is located at 212B Collen Dr Unit 3/114, Lombard, IL 60148 and is currently estimated at $192,035, approximately $175 per square foot. 212B Collen Dr Unit 3/114 is a home located in DuPage County with nearby schools including Wm Hammerschmidt Elementary School, Madison Elementary School, and Butterfield Elementary School.
Ownership History
Date
Name
Owned For
Owner Type
Purchase Details
Closed on
Feb 20, 2022
Sold by
Arias Ronald
Bought by
Arias Pedro
Current Estimated Value
Purchase Details
Closed on
Jan 16, 2020
Sold by
Arias Pedro and Arias Irca
Bought by
Arias Ronald
Purchase Details
Closed on
Aug 29, 2008
Sold by
Arias Pedro and Arias Mirca
Bought by
Arias Pedro E and Arias Mirca
Purchase Details
Closed on
May 14, 2004
Sold by
Arias Pedro and Arias Mirca
Bought by
Arias Pedro E and Arias Mirca
Purchase Details
Closed on
Aug 12, 1994
Sold by
Rogers Jeffrey W
Bought by
Arias Pedro E and Arias Mirca J
Home Financials for this Owner
Home Financials are based on the most recent Mortgage that was taken out on this home.
Original Mortgage
$62,600
Interest Rate
7.75%
Mortgage Type
Purchase Money Mortgage
Create a Home Valuation Report for This Property
The Home Valuation Report is an in-depth analysis detailing your home's value as well as a comparison with similar homes in the area
Home Values in the Area
Average Home Value in this Area
Purchase History
| Date | Buyer | Sale Price | Title Company |
|---|---|---|---|
| Arias Pedro | -- | Arias Ronald | |
| Arias Ronald | -- | None Available | |
| Arias Pedro E | -- | None Available | |
| Arias Pedro E | -- | -- | |
| Arias Pedro E | $66,000 | Attorneys Title Guaranty Fun |
Source: Public Records
Mortgage History
| Date | Status | Borrower | Loan Amount |
|---|---|---|---|
| Previous Owner | Arias Pedro E | $62,600 |
Source: Public Records
Tax History Compared to Growth
Tax History
| Year | Tax Paid | Tax Assessment Tax Assessment Total Assessment is a certain percentage of the fair market value that is determined by local assessors to be the total taxable value of land and additions on the property. | Land | Improvement |
|---|---|---|---|---|
| 2024 | $1,876 | $40,142 | $4,012 | $36,130 |
| 2023 | $1,698 | $37,120 | $3,710 | $33,410 |
| 2022 | $1,943 | $35,350 | $3,550 | $31,800 |
| 2021 | $1,863 | $34,470 | $3,460 | $31,010 |
| 2020 | $1,807 | $33,710 | $3,380 | $30,330 |
| 2019 | $1,679 | $32,050 | $3,210 | $28,840 |
| 2018 | $1,731 | $26,850 | $2,690 | $24,160 |
| 2017 | $1,520 | $23,900 | $2,390 | $21,510 |
| 2016 | $1,135 | $18,880 | $1,900 | $16,980 |
| 2015 | $1,041 | $17,590 | $1,770 | $15,820 |
| 2014 | $1,526 | $22,490 | $2,260 | $20,230 |
| 2013 | $1,508 | $22,800 | $2,290 | $20,510 |
Source: Public Records
Map
Nearby Homes
- 1313 S Rebecca Rd Unit 118A
- 1313 S Rebecca Rd Unit 113
- 1313 S Rebecca Rd Unit B111
- 120A Collen Dr Unit 105
- 120A Collen Dr Unit 202
- 1320 Lore Ln Unit 107B
- 1320A Lore Ln Unit 101
- 1324 S Main St
- 1311 S Finley Rd Unit 204
- 1419 Colony Ct
- 1520 S Elizabeth St
- 450 Manor Hill Ln
- 451 S Garfield St
- 111 E 13th St
- 1133 S Finley Rd Unit 410
- 1450 S Stewart Ave
- 484 Woodmoor Dr
- 102 Norbury Ave
- 1310 S Lombard Ave
- 1621 S Highland Ave
- 212B Collen Dr Unit 217
- 212A Collen Dr Unit 102
- 212A Collen Dr Unit 123
- 212A Collen Dr Unit 105
- 212A Collen Dr Unit 202
- 212B Collen Dr Unit 211
- 212A Collen Dr Unit 219
- 212B Collen Dr Unit 214
- 212A Collen Dr Unit 118
- 212B Collen Dr Unit 115
- 212B Collen Dr Unit 208
- 212B Collen Dr Unit 213
- 212B Collen Dr Unit 109
- 212A Collen Dr Unit 223
- 212B Collen Dr Unit 216
- 212A Collen Dr Unit 222
- 212B Collen Dr Unit 114
- 212A Collen Dr Unit 218
- 212B Collen Dr Unit 215
- 212B Collen Dr Unit 108