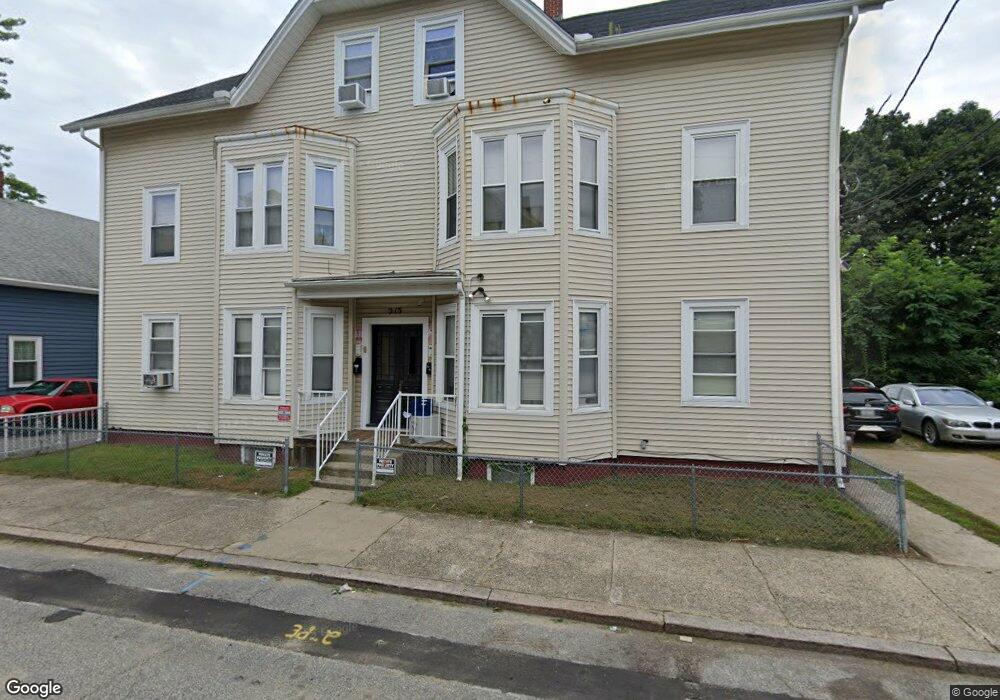
213 3rd Ave Woonsocket, RI 02895
Fairmount NeighborhoodEstimated Value: $458,000 - $607,000
6
Beds
3
Baths
4,788
Sq Ft
$112/Sq Ft
Est. Value
About This Home
This home is located at 213 3rd Ave, Woonsocket, RI 02895 and is currently estimated at $534,667, approximately $111 per square foot. 213 3rd Ave is a home located in Providence County with nearby schools including Woonsocket High School, Rise Prep Mayoral Academy Middle School, and Rise Prep Mayoral Academy.
Ownership History
Date
Name
Owned For
Owner Type
Purchase Details
Closed on
Jan 2, 2019
Sold by
213 3Rd Ave Llc
Bought by
Pioneer Investments Llc
Current Estimated Value
Home Financials for this Owner
Home Financials are based on the most recent Mortgage that was taken out on this home.
Original Mortgage
$200,000
Outstanding Balance
$174,818
Interest Rate
4.8%
Mortgage Type
Commercial
Estimated Equity
$359,849
Purchase Details
Closed on
Aug 23, 2018
Sold by
Hlywka Michael R
Bought by
213 3Rd Ave Llc
Home Financials for this Owner
Home Financials are based on the most recent Mortgage that was taken out on this home.
Original Mortgage
$190,000
Interest Rate
4.5%
Mortgage Type
Commercial
Create a Home Valuation Report for This Property
The Home Valuation Report is an in-depth analysis detailing your home's value as well as a comparison with similar homes in the area
Home Values in the Area
Average Home Value in this Area
Purchase History
| Date | Buyer | Sale Price | Title Company |
|---|---|---|---|
| Pioneer Investments Llc | $126,000 | -- | |
| Pioneer Investments Llc | $126,000 | -- | |
| Pioneer Investments Llc | $126,000 | -- | |
| 213 3Rd Ave Llc | $112,000 | -- | |
| 213 3Rd Ave Llc | $112,000 | -- |
Source: Public Records
Mortgage History
| Date | Status | Borrower | Loan Amount |
|---|---|---|---|
| Open | Pioneer Investments Llc | $200,000 | |
| Closed | Pioneer Investments Llc | $200,000 | |
| Previous Owner | 213 3Rd Ave Llc | $190,000 |
Source: Public Records
Tax History
| Year | Tax Paid | Tax Assessment Tax Assessment Total Assessment is a certain percentage of the fair market value that is determined by local assessors to be the total taxable value of land and additions on the property. | Land | Improvement |
|---|---|---|---|---|
| 2025 | $7,350 | $654,500 | $90,400 | $564,100 |
| 2024 | $5,643 | $388,100 | $92,100 | $296,000 |
| 2023 | $5,426 | $388,100 | $92,100 | $296,000 |
| 2022 | $5,426 | $388,100 | $92,100 | $296,000 |
| 2021 | $4,752 | $200,100 | $37,600 | $162,500 |
| 2020 | $4,802 | $200,100 | $37,600 | $162,500 |
| 2018 | $4,257 | $176,800 | $37,600 | $139,200 |
| 2017 | $4,675 | $155,300 | $41,100 | $114,200 |
| 2016 | $4,945 | $155,300 | $41,100 | $114,200 |
| 2015 | $5,681 | $155,300 | $41,100 | $114,200 |
| 2014 | $4,885 | $142,400 | $45,300 | $97,100 |
Source: Public Records
Map
Nearby Homes
- 123 4th Ave
- 83 4th Ave
- 0 10th Ave
- 10 10th Ave
- 36 Fairmount St
- 0 Holbrook Ln Unit 1402850
- 372 River St
- 435 S Main St
- 120 East St
- 190 Coe St
- 84 Bernice Ave
- 308 Harris Ave
- 43 Summit St
- 42 Transit St
- 184 Avenue C Unit 2
- 184 Avenue C Unit 5
- 184 Avenue C Unit 6
- 184 Avenue C Unit 3
- 184 Avenue C Unit 4
- 184 Avenue C Unit 1
Your Personal Tour Guide
Ask me questions while you tour the home.