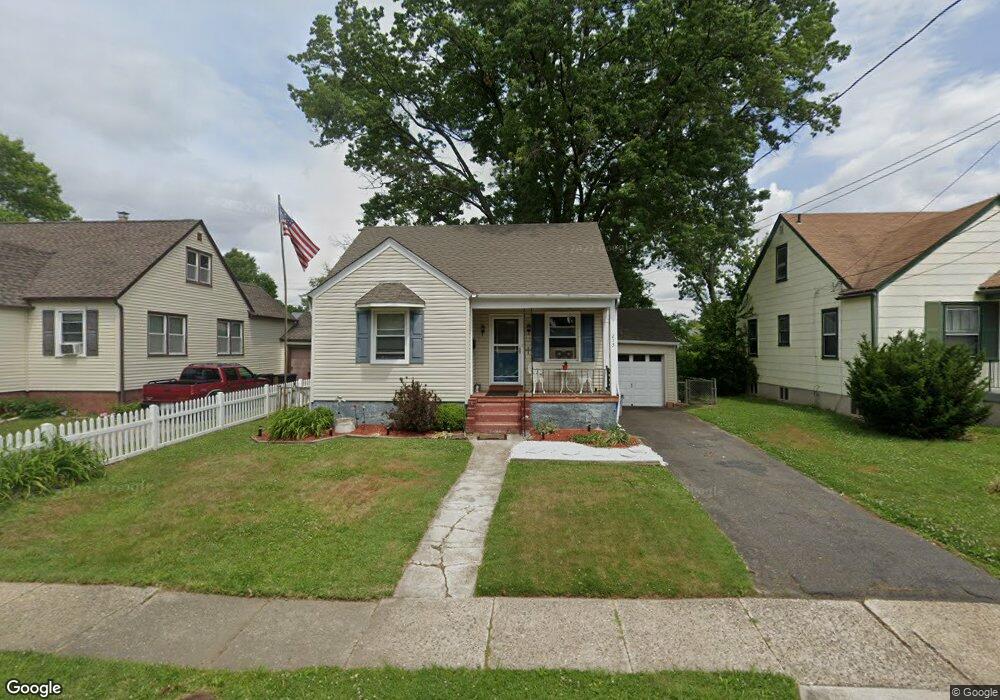
213 5th Ave Mount Ephraim, NJ 08059
Estimated Value: $250,000 - $368,000
3
Beds
1
Bath
991
Sq Ft
$303/Sq Ft
Est. Value
About This Home
This home is located at 213 5th Ave, Mount Ephraim, NJ 08059 and is currently estimated at $300,531, approximately $303 per square foot. 213 5th Ave is a home located in Camden County with nearby schools including Mary Bray Elementary School and Raymond W. Kershaw Elementary School.
Ownership History
Date
Name
Owned For
Owner Type
Purchase Details
Closed on
Apr 3, 2021
Sold by
Meghan Hannigan
Bought by
Hannigan Brian
Current Estimated Value
Purchase Details
Closed on
May 6, 2005
Sold by
Giumarello Joseph and Giumarello Kathleen
Bought by
Hannigan Brian
Home Financials for this Owner
Home Financials are based on the most recent Mortgage that was taken out on this home.
Original Mortgage
$144,650
Interest Rate
5.95%
Mortgage Type
FHA
Purchase Details
Closed on
Dec 30, 2004
Sold by
Falcone Judith
Bought by
Giumarello Joseph and Giumarello Kathleen
Create a Home Valuation Report for This Property
The Home Valuation Report is an in-depth analysis detailing your home's value as well as a comparison with similar homes in the area
Home Values in the Area
Average Home Value in this Area
Purchase History
| Date | Buyer | Sale Price | Title Company |
|---|---|---|---|
| Hannigan Brian | -- | None Listed On Document | |
| Hannigan Brian | $147,000 | -- | |
| Giumarello Joseph | $50,000 | -- |
Source: Public Records
Mortgage History
| Date | Status | Borrower | Loan Amount |
|---|---|---|---|
| Previous Owner | Hannigan Brian | $144,650 | |
| Previous Owner | Hannigan Brian | $5,786 |
Source: Public Records
Tax History
| Year | Tax Paid | Tax Assessment Tax Assessment Total Assessment is a certain percentage of the fair market value that is determined by local assessors to be the total taxable value of land and additions on the property. | Land | Improvement |
|---|---|---|---|---|
| 2025 | $6,542 | $125,200 | $39,500 | $85,700 |
| 2024 | $6,455 | $125,200 | $39,500 | $85,700 |
| 2023 | $6,455 | $125,200 | $39,500 | $85,700 |
| 2022 | $6,281 | $125,200 | $39,500 | $85,700 |
| 2021 | $6,106 | $125,200 | $39,500 | $85,700 |
| 2020 | $5,941 | $125,200 | $39,500 | $85,700 |
| 2019 | $5,833 | $125,200 | $39,500 | $85,700 |
| 2018 | $5,782 | $125,200 | $39,500 | $85,700 |
| 2017 | $5,697 | $125,200 | $39,500 | $85,700 |
| 2016 | $5,518 | $125,200 | $39,500 | $85,700 |
| 2015 | $5,327 | $125,200 | $39,500 | $85,700 |
| 2014 | $5,334 | $79,100 | $25,000 | $54,100 |
Source: Public Records
Map
Nearby Homes
- 117 6th Ave
- 113 Center Ave
- 17 W Buckingham Ave
- 27 Goldy Dr
- 12 George St
- 40 W Kings Hwy
- 27 Lincoln Ave
- 112 Mount Ephraim Ave
- 51 Lincoln Ave
- 7 Lincoln Ave
- 553 Maple Ave
- 187 Gehrig Ave
- 234 Lowell Ave
- 918 Highland Blvd
- 1417 Chestnut Ave
- 14 Nicholson Rd
- 5 Myrtle Ave
- 1 Myrtle Ave
- 3 Myrtle Ave
- 121 Marlborough Ave
Your Personal Tour Guide
Ask me questions while you tour the home.