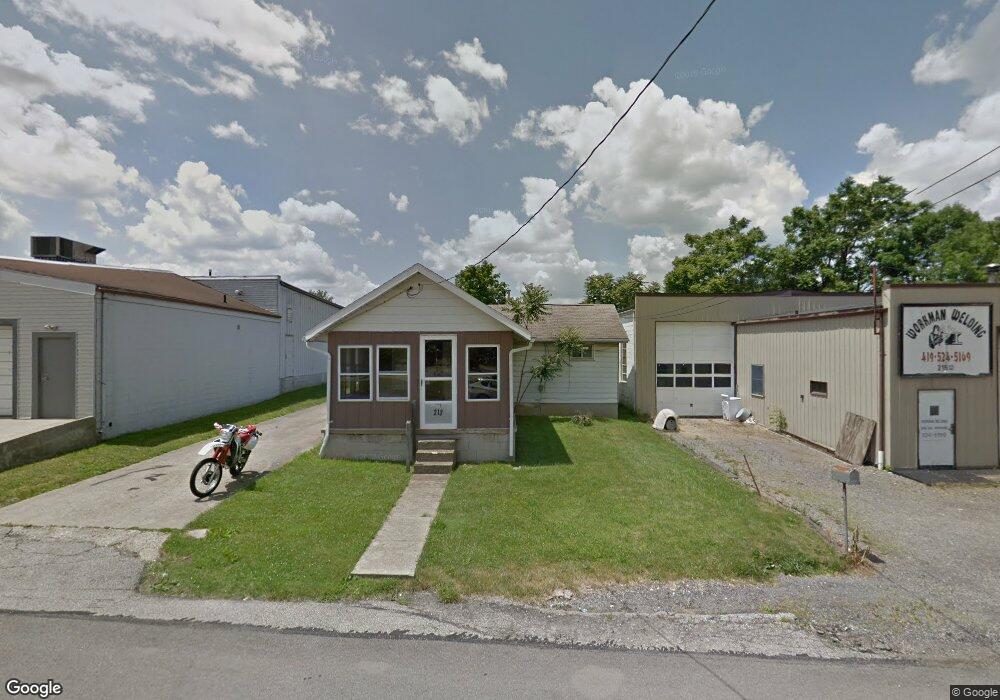
213 6th Ave Mansfield, OH 44905
Estimated Value: $103,000 - $185,000
2
Beds
1
Bath
950
Sq Ft
$152/Sq Ft
Est. Value
About This Home
This home is located at 213 6th Ave, Mansfield, OH 44905 and is currently estimated at $144,000, approximately $151 per square foot. 213 6th Ave is a home located in Richland County with nearby schools including Madison High School, St. Peter's Elementary/Montessori School, and Temple-Christian School.
Ownership History
Date
Name
Owned For
Owner Type
Purchase Details
Closed on
Jul 29, 2025
Sold by
Pony Properties Mansfield Llc
Bought by
Taz Tires 10 Llc
Current Estimated Value
Home Financials for this Owner
Home Financials are based on the most recent Mortgage that was taken out on this home.
Original Mortgage
$372,000
Interest Rate
6.26%
Mortgage Type
Credit Line Revolving
Purchase Details
Closed on
May 10, 2016
Sold by
Mc Cune Cycle World Inc
Bought by
Pony Properties Mansfield Llc
Home Financials for this Owner
Home Financials are based on the most recent Mortgage that was taken out on this home.
Original Mortgage
$260,000
Interest Rate
3.71%
Mortgage Type
Credit Line Revolving
Purchase Details
Closed on
Oct 31, 2007
Sold by
Stage Wanetta I and Hamilton Bart W
Bought by
Mccune Cycle World Inc
Create a Home Valuation Report for This Property
The Home Valuation Report is an in-depth analysis detailing your home's value as well as a comparison with similar homes in the area
Home Values in the Area
Average Home Value in this Area
Purchase History
| Date | Buyer | Sale Price | Title Company |
|---|---|---|---|
| Taz Tires 10 Llc | $465,000 | Equity Settlement Services | |
| Pony Properties Mansfield Llc | $325,000 | Assurance Title Agency Of Oh | |
| Mccune Cycle World Inc | $23,000 | Chicago Title Nita |
Source: Public Records
Mortgage History
| Date | Status | Borrower | Loan Amount |
|---|---|---|---|
| Previous Owner | Taz Tires 10 Llc | $372,000 | |
| Previous Owner | Pony Properties Mansfield Llc | $260,000 |
Source: Public Records
Tax History
| Year | Tax Paid | Tax Assessment Tax Assessment Total Assessment is a certain percentage of the fair market value that is determined by local assessors to be the total taxable value of land and additions on the property. | Land | Improvement |
|---|---|---|---|---|
| 2024 | $151 | $3,650 | $3,650 | $0 |
| 2023 | $151 | $3,650 | $3,650 | $0 |
| 2022 | $601 | $13,390 | $3,800 | $9,590 |
| 2021 | $601 | $13,390 | $3,800 | $9,590 |
| 2020 | $607 | $13,390 | $3,800 | $9,590 |
| 2019 | $579 | $11,540 | $3,230 | $8,310 |
| 2018 | $574 | $11,540 | $3,230 | $8,310 |
| 2017 | $562 | $11,540 | $3,230 | $8,310 |
| 2016 | $569 | $11,390 | $3,130 | $8,260 |
| 2015 | $558 | $11,390 | $3,130 | $8,260 |
| 2014 | $556 | $11,390 | $3,130 | $8,260 |
| 2012 | $269 | $11,750 | $3,230 | $8,520 |
Source: Public Records
Map
Nearby Homes
Your Personal Tour Guide
Ask me questions while you tour the home.