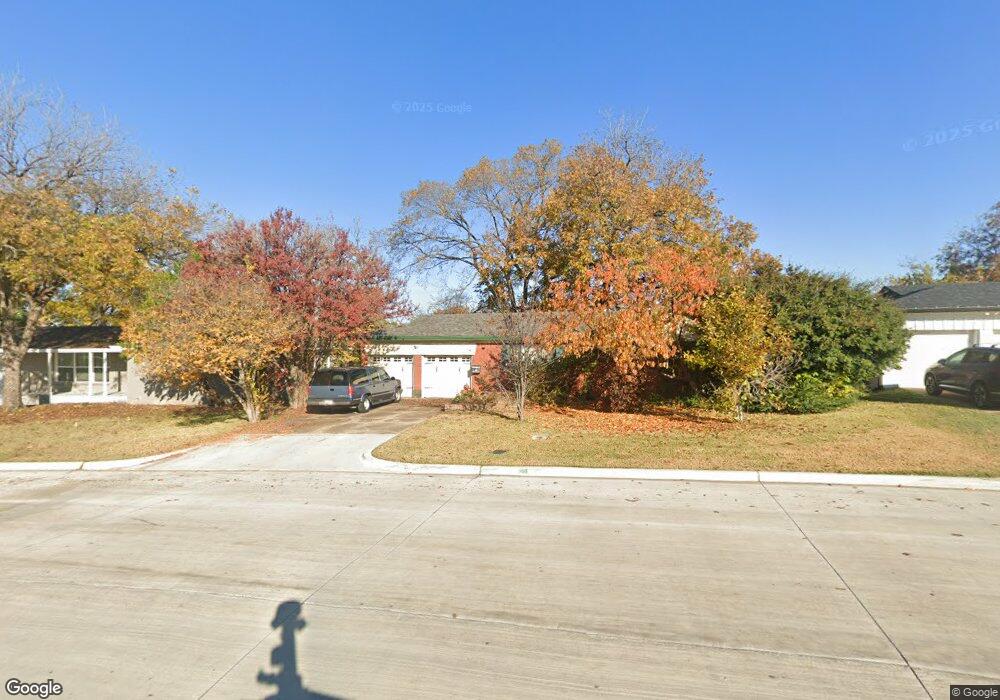
213 Bedford Ct E Bedford, TX 76022
Estimated Value: $240,000 - $296,000
3
Beds
2
Baths
1,430
Sq Ft
$185/Sq Ft
Est. Value
About This Home
This home is located at 213 Bedford Ct E, Bedford, TX 76022 and is currently estimated at $264,065, approximately $184 per square foot. 213 Bedford Ct E is a home located in Tarrant County with nearby schools including Stonegate Elementary School, Hurst J High School, and L.D. Bell High School.
Ownership History
Date
Name
Owned For
Owner Type
Purchase Details
Closed on
Nov 12, 2013
Sold by
Gaston Robert
Bought by
Neal Sapphire
Current Estimated Value
Home Financials for this Owner
Home Financials are based on the most recent Mortgage that was taken out on this home.
Original Mortgage
$125,190
Outstanding Balance
$97,856
Interest Rate
5.5%
Mortgage Type
FHA
Estimated Equity
$166,209
Purchase Details
Closed on
Mar 29, 2013
Sold by
Heb Homes Llc
Bought by
Gaston Robert
Purchase Details
Closed on
Feb 7, 2001
Sold by
Coahran Gregory Dale
Bought by
James Coahran Sharla Jo
Home Financials for this Owner
Home Financials are based on the most recent Mortgage that was taken out on this home.
Original Mortgage
$60,700
Interest Rate
7.04%
Mortgage Type
Seller Take Back
Create a Home Valuation Report for This Property
The Home Valuation Report is an in-depth analysis detailing your home's value as well as a comparison with similar homes in the area
Home Values in the Area
Average Home Value in this Area
Purchase History
| Date | Buyer | Sale Price | Title Company |
|---|---|---|---|
| Neal Sapphire | -- | Fatco | |
| Gaston Robert | -- | Providence Title Company | |
| Heb Homes Llc | -- | Providence Title | |
| James Coahran Sharla Jo | -- | -- |
Source: Public Records
Mortgage History
| Date | Status | Borrower | Loan Amount |
|---|---|---|---|
| Open | Neal Sapphire | $125,190 | |
| Previous Owner | James Coahran Sharla Jo | $60,700 |
Source: Public Records
Tax History Compared to Growth
Tax History
| Year | Tax Paid | Tax Assessment Tax Assessment Total Assessment is a certain percentage of the fair market value that is determined by local assessors to be the total taxable value of land and additions on the property. | Land | Improvement |
|---|---|---|---|---|
| 2025 | $2,585 | $224,405 | $55,000 | $169,405 |
| 2024 | $2,585 | $224,405 | $55,000 | $169,405 |
| 2023 | $3,359 | $205,418 | $35,000 | $170,418 |
| 2022 | $3,477 | $178,166 | $35,000 | $143,166 |
| 2021 | $3,409 | $173,314 | $35,000 | $138,314 |
| 2020 | $3,128 | $139,969 | $35,000 | $104,969 |
| 2019 | $2,906 | $143,801 | $35,000 | $108,801 |
| 2018 | $2,260 | $108,743 | $16,000 | $92,743 |
| 2017 | $2,391 | $133,013 | $16,000 | $117,013 |
| 2016 | $2,174 | $107,747 | $16,000 | $91,747 |
| 2015 | $2,052 | $81,700 | $15,000 | $66,700 |
| 2014 | $2,052 | $81,700 | $15,000 | $66,700 |
Source: Public Records
Map
Nearby Homes
- 905 Brown Trail
- 1136 Simpson Dr
- 1220 Norwood Dr
- 344 Bedford Ct E
- 341 Hurst Dr
- 116 Oakhurst Dr
- 1008 Russell Ln
- 802 Brown Trail
- 803 Glenda Dr
- 1348 Norwood Dr
- 1236 King Dr
- 849 Russell Ln
- 1016 Keith Dr
- 1352 Simpson Dr
- 1337 Harrison Ln
- 501 Merrill Dr
- 409 Vicki Place
- 49 Coffee Tavern Rd
- 420 Bedford Ct W
- 113 Sunnyvale Terrace
- 217 Bedford Ct E
- 209 Bedford Ct E
- 260 Belle St
- 264 Belle St
- 256 Belle St
- 221 Bedford Ct E
- 221 Bedford Ct E Unit 212
- 268 Belle St
- 205 Bedford Ct E
- 252 Belle St
- 212 Bedford Ct E
- 208 Bedford Ct E
- 225 Bedford Ct E
- 216 Bedford Ct E
- 272 Belle St
- 248 Belle St
- 220 Bedford Ct E
- 259 Belle St
- 255 Belle St
- 263 Belle St