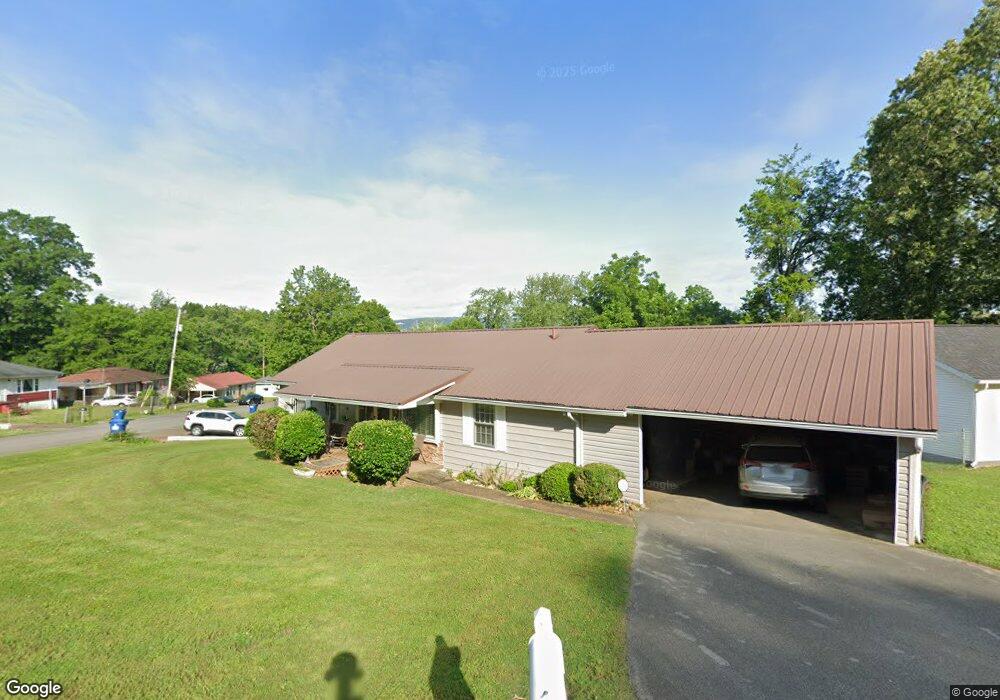
213 Beech St Rossville, GA 30741
Estimated Value: $180,000 - $186,103
3
Beds
2
Baths
1,302
Sq Ft
$141/Sq Ft
Est. Value
About This Home
This home is located at 213 Beech St, Rossville, GA 30741 and is currently estimated at $183,276, approximately $140 per square foot. 213 Beech St is a home located in Walker County with nearby schools including Rossville Elementary School, Rossville Middle School, and Ridgeland High School.
Ownership History
Date
Name
Owned For
Owner Type
Purchase Details
Closed on
Feb 14, 2025
Sold by
Tankersley Tommy C
Bought by
Mcgarity Sandra and Mcgarity Gene
Current Estimated Value
Purchase Details
Closed on
Nov 17, 2006
Sold by
Strange Margaret C Jenki
Bought by
Tankersley Tommy C
Home Financials for this Owner
Home Financials are based on the most recent Mortgage that was taken out on this home.
Original Mortgage
$24,000
Interest Rate
6.33%
Mortgage Type
New Conventional
Purchase Details
Closed on
May 13, 1988
Sold by
Jenkins Danny E and Jenkins Margaret
Bought by
Strange Margaret C Jenkins
Purchase Details
Closed on
Oct 27, 1977
Sold by
Jones David Stanton and Jones Wf
Bought by
Jenkins Danny E and Jenkins Margaret
Purchase Details
Closed on
May 1, 1976
Sold by
Cooper Bill Kendall
Bought by
Jones David Stanton and Jones Wf
Purchase Details
Closed on
Jul 30, 1965
Bought by
Cooper Bill Kendall
Create a Home Valuation Report for This Property
The Home Valuation Report is an in-depth analysis detailing your home's value as well as a comparison with similar homes in the area
Home Values in the Area
Average Home Value in this Area
Purchase History
| Date | Buyer | Sale Price | Title Company |
|---|---|---|---|
| Mcgarity Sandra | $175,000 | -- | |
| Tankersley Tommy C | $92,000 | -- | |
| Strange Margaret C Jenkins | -- | -- | |
| Jenkins Danny E | -- | -- | |
| Jones David Stanton | -- | -- | |
| Cooper Bill Kendall | -- | -- |
Source: Public Records
Mortgage History
| Date | Status | Borrower | Loan Amount |
|---|---|---|---|
| Previous Owner | Tankersley Tommy C | $24,000 |
Source: Public Records
Tax History Compared to Growth
Tax History
| Year | Tax Paid | Tax Assessment Tax Assessment Total Assessment is a certain percentage of the fair market value that is determined by local assessors to be the total taxable value of land and additions on the property. | Land | Improvement |
|---|---|---|---|---|
| 2024 | -- | $57,252 | $3,872 | $53,380 |
| 2023 | $2,075 | $54,492 | $3,872 | $50,620 |
| 2022 | $2,075 | $55,651 | $3,872 | $51,779 |
| 2021 | $1,547 | $38,356 | $2,582 | $35,774 |
| 2020 | $1,299 | $31,192 | $2,582 | $28,610 |
| 2019 | $1,299 | $31,192 | $2,582 | $28,610 |
| 2018 | $109 | $31,192 | $2,582 | $28,610 |
| 2017 | $928 | $31,192 | $2,582 | $28,610 |
| 2016 | $1,183 | $31,192 | $2,582 | $28,610 |
| 2015 | -- | $36,195 | $3,888 | $32,307 |
| 2014 | -- | $36,195 | $3,888 | $32,307 |
| 2013 | -- | $36,194 | $3,888 | $32,306 |
Source: Public Records
Map
Nearby Homes
- 115 Beech St
- 0 Dempsey Ln Unit 1504691
- 189 Leinbach Rd
- 39 Clift Trail
- 806 Mcfarland Ave
- 301 Dempsey Ln
- 141 Hogan Rd
- 0 S Mission Ridge Dr Unit 1504695
- 405 Miami Ave
- 916 Logan Ave
- 200 W Oak St
- 71 Georgia Terrace
- 136 Summit St
- Lot 81 Battle Bluff Dr
- Lot 80 Battle Bluff Dr
- Lot 79 Battle Bluff Dr
- 1204 Wooden Ave
- 127 Summitt St