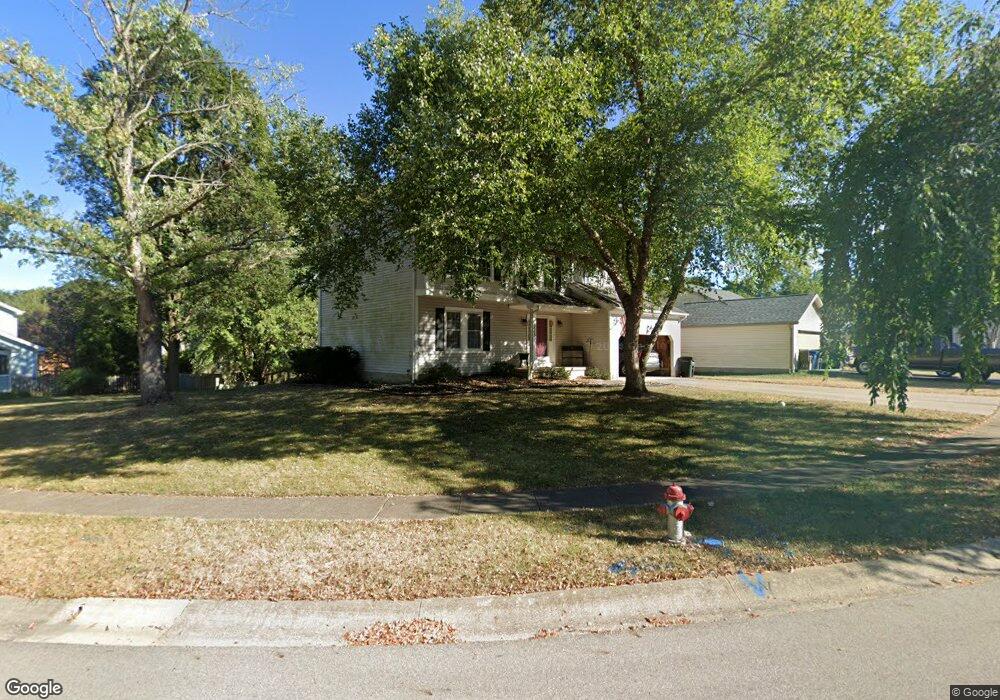
213 Benton Way Columbus, OH 43230
Woodside Green NeighborhoodEstimated Value: $406,033 - $438,000
4
Beds
3
Baths
2,032
Sq Ft
$205/Sq Ft
Est. Value
About This Home
This home is located at 213 Benton Way, Columbus, OH 43230 and is currently estimated at $417,008, approximately $205 per square foot. 213 Benton Way is a home located in Franklin County with nearby schools including Chapelfield Elementary School, Gahanna West Middle School, and Lincoln High School.
Ownership History
Date
Name
Owned For
Owner Type
Purchase Details
Closed on
Aug 2, 2002
Sold by
Cendant Mobility Financial Corp
Bought by
Annis Gregory M and Annis Karen S
Current Estimated Value
Home Financials for this Owner
Home Financials are based on the most recent Mortgage that was taken out on this home.
Original Mortgage
$161,600
Outstanding Balance
$68,772
Interest Rate
6.63%
Estimated Equity
$348,236
Purchase Details
Closed on
Jul 29, 2002
Sold by
Johnson Douglas G and Johnson Anita L
Bought by
Cendant Mobility Financial Corp
Home Financials for this Owner
Home Financials are based on the most recent Mortgage that was taken out on this home.
Original Mortgage
$161,600
Outstanding Balance
$68,772
Interest Rate
6.63%
Estimated Equity
$348,236
Purchase Details
Closed on
Aug 9, 1997
Sold by
Flood Anthony and Flood Stella M
Bought by
Johnson Douglas G and Johnson Anita L
Home Financials for this Owner
Home Financials are based on the most recent Mortgage that was taken out on this home.
Original Mortgage
$122,400
Interest Rate
5.87%
Mortgage Type
Assumption
Purchase Details
Closed on
Nov 5, 1990
Purchase Details
Closed on
Nov 1, 1986
Create a Home Valuation Report for This Property
The Home Valuation Report is an in-depth analysis detailing your home's value as well as a comparison with similar homes in the area
Home Values in the Area
Average Home Value in this Area
Purchase History
| Date | Buyer | Sale Price | Title Company |
|---|---|---|---|
| Annis Gregory M | $170,200 | The Midland Celtic Title Gro | |
| Cendant Mobility Financial Corp | $170,000 | The Midland Celtic Title Gro | |
| Johnson Douglas G | $136,000 | Midland Title Security Inc | |
| -- | $116,200 | -- | |
| -- | $103,900 | -- |
Source: Public Records
Mortgage History
| Date | Status | Borrower | Loan Amount |
|---|---|---|---|
| Open | Annis Gregory M | $161,600 | |
| Previous Owner | Johnson Douglas G | $122,400 |
Source: Public Records
Tax History Compared to Growth
Tax History
| Year | Tax Paid | Tax Assessment Tax Assessment Total Assessment is a certain percentage of the fair market value that is determined by local assessors to be the total taxable value of land and additions on the property. | Land | Improvement |
|---|---|---|---|---|
| 2024 | $6,676 | $113,330 | $28,700 | $84,630 |
| 2023 | $6,593 | $113,330 | $28,700 | $84,630 |
| 2022 | $6,163 | $82,530 | $18,900 | $63,630 |
| 2021 | $5,961 | $82,530 | $18,900 | $63,630 |
| 2020 | $5,911 | $82,530 | $18,900 | $63,630 |
| 2019 | $4,922 | $68,570 | $15,750 | $52,820 |
| 2018 | $4,603 | $68,570 | $15,750 | $52,820 |
| 2017 | $4,417 | $68,570 | $15,750 | $52,820 |
| 2016 | $4,317 | $59,680 | $14,110 | $45,570 |
| 2015 | $4,320 | $59,680 | $14,110 | $45,570 |
| 2014 | $4,287 | $59,680 | $14,110 | $45,570 |
| 2013 | $2,129 | $59,675 | $14,105 | $45,570 |
Source: Public Records
Map
Nearby Homes
- 111 Nob Hill Dr N
- 108 Walcreek Dr W
- 642 Ridenour Rd
- 402 Bluestem Ave
- 459 Bluestem Ave
- 536 Springwood Lake Dr
- 211 Crossing Creek N
- 3544 Halpern St
- 0 Wendler Blvd
- 200 Glenhurst Ct
- 167 Greenbank Rd
- 638 Thistle Ave
- 158 Windrow Ct
- 3555 Tami Place
- 3877 Hines Rd
- 3150 Berkley Pointe Dr
- 3118 Berkley Pointe Dr
- 302 Zander Ln Unit 302
- 365 Sycamore Woods Ln Unit 365
- 308 Villa Oaks Ln
- 225 Benton Way
- 282 Sumption Dr
- 201 Benton Way
- 280 Sumption Dr
- 235 Benton Way
- 214 Benton Way
- 208 Benton Way
- 220 Benton Way
- 226 Benton Way
- 278 Sumption Dr
- 202 Benton Way
- 232 Benton Way
- 294 Sumption Dr
- 276 Sumption Dr
- 240 Benton Way
- 245 Benton Way
- 310 Sumption Dr
- 306 Sumption Dr
- 250 Benton Way
- 274 Sumption Dr