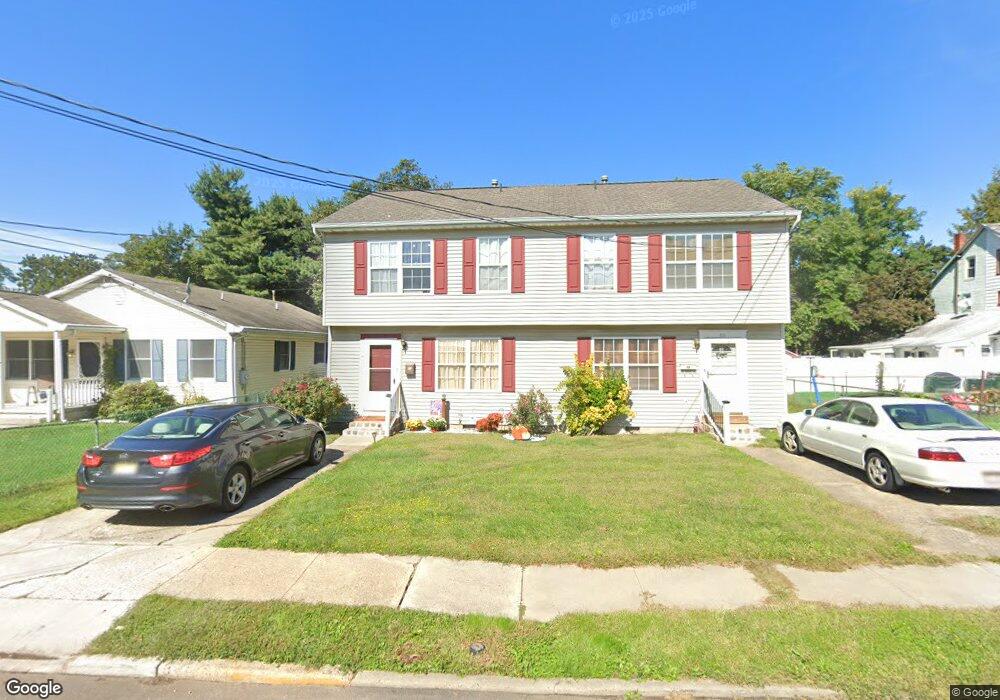
213 Brown St Burlington, NJ 08016
Estimated Value: $194,000 - $266,000
--
Bed
--
Bath
1,080
Sq Ft
$219/Sq Ft
Est. Value
About This Home
This home is located at 213 Brown St, Burlington, NJ 08016 and is currently estimated at $236,982, approximately $219 per square foot. 213 Brown St is a home located in Burlington County with nearby schools including Burlington City High School, Doane Academy, and St Paul's Parochial School.
Ownership History
Date
Name
Owned For
Owner Type
Purchase Details
Closed on
Mar 11, 2022
Sold by
Yeretzian Steven
Bought by
Mcgrath Tracy and Mcgrath Brian
Current Estimated Value
Home Financials for this Owner
Home Financials are based on the most recent Mortgage that was taken out on this home.
Original Mortgage
$174,775
Interest Rate
3.85%
Mortgage Type
New Conventional
Purchase Details
Closed on
Aug 25, 2006
Sold by
Stockton Nicholas W
Bought by
Yeretzian Steven
Purchase Details
Closed on
Dec 22, 1994
Sold by
Brewer Ted and Brewer Theodore W
Bought by
Stockton Ward E
Create a Home Valuation Report for This Property
The Home Valuation Report is an in-depth analysis detailing your home's value as well as a comparison with similar homes in the area
Home Values in the Area
Average Home Value in this Area
Purchase History
| Date | Buyer | Sale Price | Title Company |
|---|---|---|---|
| Mcgrath Tracy | $178,000 | -- | |
| Mcgrath Tracy | $178,000 | None Listed On Document | |
| Yeretzian Steven | $79,500 | None Available | |
| Stockton Ward E | $89,000 | Commonwealth Land Title Ins |
Source: Public Records
Mortgage History
| Date | Status | Borrower | Loan Amount |
|---|---|---|---|
| Previous Owner | Mcgrath Tracy | $174,775 |
Source: Public Records
Tax History Compared to Growth
Tax History
| Year | Tax Paid | Tax Assessment Tax Assessment Total Assessment is a certain percentage of the fair market value that is determined by local assessors to be the total taxable value of land and additions on the property. | Land | Improvement |
|---|---|---|---|---|
| 2025 | $5,824 | $134,500 | $36,000 | $98,500 |
| 2024 | $5,722 | $134,500 | $36,000 | $98,500 |
| 2023 | $5,722 | $134,500 | $36,000 | $98,500 |
| 2022 | $5,658 | $134,500 | $36,000 | $98,500 |
| 2021 | $5,576 | $134,500 | $36,000 | $98,500 |
| 2020 | $5,377 | $134,500 | $36,000 | $98,500 |
| 2019 | $5,128 | $134,500 | $36,000 | $98,500 |
| 2018 | $5,041 | $134,500 | $36,000 | $98,500 |
| 2017 | $4,886 | $134,500 | $36,000 | $98,500 |
| 2016 | $4,702 | $134,500 | $36,000 | $98,500 |
| 2015 | $4,534 | $134,500 | $36,000 | $98,500 |
| 2014 | $4,385 | $134,500 | $36,000 | $98,500 |
Source: Public Records
Map
Nearby Homes