Estimated Value: $215,000 - $235,000
3
Beds
2
Baths
1,453
Sq Ft
$156/Sq Ft
Est. Value
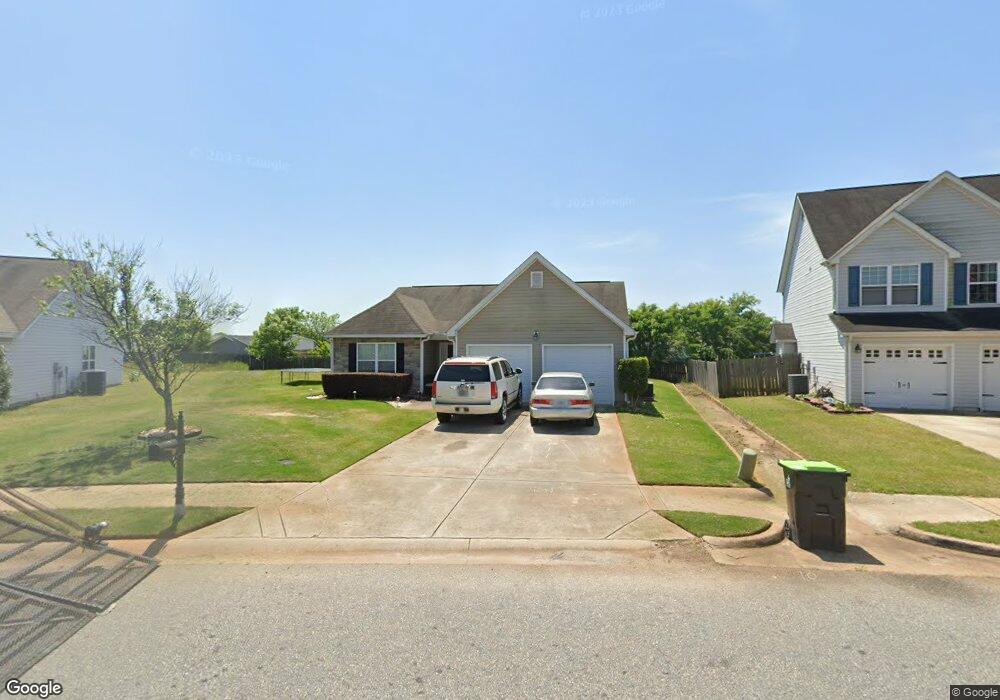
About This Home
This home is located at 213 Burr Dr, Byron, GA 31008 and is currently estimated at $226,972, approximately $156 per square foot. 213 Burr Dr is a home located in Houston County with nearby schools including Eagle Springs Elementary School, Thomson Middle School, and Northside High School.
Ownership History
Date
Name
Owned For
Owner Type
Purchase Details
Closed on
Jun 24, 2010
Sold by
The Knight Group Inc
Bought by
Hand Darin D
Current Estimated Value
Home Financials for this Owner
Home Financials are based on the most recent Mortgage that was taken out on this home.
Original Mortgage
$118,405
Outstanding Balance
$78,651
Interest Rate
4.79%
Mortgage Type
FHA
Estimated Equity
$148,321
Purchase Details
Closed on
Jul 6, 2006
Sold by
Eagle Springs Llc
Bought by
The Knight Group Inc
Create a Home Valuation Report for This Property
The Home Valuation Report is an in-depth analysis detailing your home's value as well as a comparison with similar homes in the area
Home Values in the Area
Average Home Value in this Area
Purchase History
| Date | Buyer | Sale Price | Title Company |
|---|---|---|---|
| Hand Darin D | $120,000 | None Available | |
| The Knight Group Inc | $17,800 | -- |
Source: Public Records
Mortgage History
| Date | Status | Borrower | Loan Amount |
|---|---|---|---|
| Open | Hand Darin D | $118,405 |
Source: Public Records
Tax History
| Year | Tax Paid | Tax Assessment Tax Assessment Total Assessment is a certain percentage of the fair market value that is determined by local assessors to be the total taxable value of land and additions on the property. | Land | Improvement |
|---|---|---|---|---|
| 2024 | $2,524 | $78,520 | $12,000 | $66,520 |
| 2023 | $2,030 | $62,960 | $10,000 | $52,960 |
| 2022 | $1,197 | $54,040 | $8,000 | $46,040 |
| 2021 | $1,066 | $48,120 | $7,000 | $41,120 |
| 2020 | $925 | $41,800 | $7,000 | $34,800 |
| 2019 | $925 | $41,800 | $7,000 | $34,800 |
| 2018 | $925 | $41,800 | $7,000 | $34,800 |
| 2017 | $926 | $41,800 | $7,000 | $34,800 |
| 2016 | $927 | $41,800 | $7,000 | $34,800 |
| 2015 | -- | $42,720 | $7,000 | $35,720 |
| 2014 | -- | $42,720 | $7,000 | $35,720 |
| 2013 | -- | $43,760 | $7,000 | $36,760 |
Source: Public Records
Map
Nearby Homes
- 105 Browning Point
- 102 Monroe Ct
- 104 Monroe Ct
- 100 Monroe Ct
- 508 Georgian Walk
- 504 Georgian Walk
- 502 Georgian Walk
- 260 Caleb Way
- 503 Georgian Walk
- 107 Monroe Ct
- 217 Caleb Way
- 220 Summerstone Bend
- 417 Covington Cove
- 721 Georgian Walk
- 732 Georgian Walk
- 110 Bulloch Ct
- 108 Chatham Ct
- 105 Vineyard Trace
- 114 Chasen Ct
- 118 Bulloch Ct
Your Personal Tour Guide
Ask me questions while you tour the home.