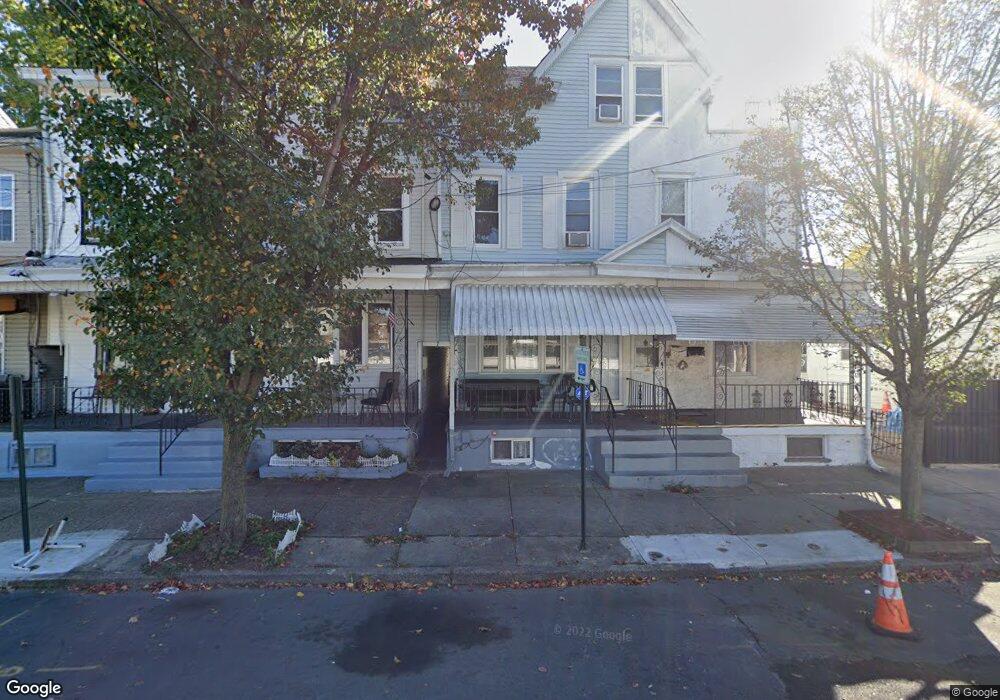
213 Butler St Trenton, NJ 08611
Chambersburg NeighborhoodEstimated Value: $195,000 - $228,000
4
Beds
2
Baths
1,294
Sq Ft
$163/Sq Ft
Est. Value
About This Home
This home is located at 213 Butler St, Trenton, NJ 08611 and is currently estimated at $211,104, approximately $163 per square foot. 213 Butler St is a home located in Mercer County with nearby schools including Robbins Elementary School, Monument Elementary School, and Dr. Martin Luther King Middle School.
Ownership History
Date
Name
Owned For
Owner Type
Purchase Details
Closed on
Dec 19, 2016
Sold by
Digiorgio Judith A
Bought by
213 Butler Llc
Current Estimated Value
Purchase Details
Closed on
Apr 24, 1997
Sold by
Belardino Carmela
Bought by
Digiorgio Dina and Digiorgio Judith
Home Financials for this Owner
Home Financials are based on the most recent Mortgage that was taken out on this home.
Original Mortgage
$48,000
Interest Rate
7.85%
Create a Home Valuation Report for This Property
The Home Valuation Report is an in-depth analysis detailing your home's value as well as a comparison with similar homes in the area
Home Values in the Area
Average Home Value in this Area
Purchase History
| Date | Buyer | Sale Price | Title Company |
|---|---|---|---|
| 213 Butler Llc | $40,000 | Sterling Title Agency | |
| Digiorgio Dina | $53,000 | -- |
Source: Public Records
Mortgage History
| Date | Status | Borrower | Loan Amount |
|---|---|---|---|
| Previous Owner | Digiorgio Dina | $48,000 |
Source: Public Records
Tax History Compared to Growth
Tax History
| Year | Tax Paid | Tax Assessment Tax Assessment Total Assessment is a certain percentage of the fair market value that is determined by local assessors to be the total taxable value of land and additions on the property. | Land | Improvement |
|---|---|---|---|---|
| 2025 | $3,173 | $54,700 | $8,900 | $45,800 |
| 2024 | $3,045 | $54,700 | $8,900 | $45,800 |
| 2023 | $3,045 | $54,700 | $8,900 | $45,800 |
| 2022 | $2,986 | $54,700 | $8,900 | $45,800 |
| 2021 | $3,037 | $54,700 | $8,900 | $45,800 |
| 2020 | $3,028 | $54,700 | $8,900 | $45,800 |
| 2019 | $2,979 | $54,700 | $8,900 | $45,800 |
| 2018 | $2,852 | $54,700 | $8,900 | $45,800 |
| 2017 | $2,710 | $54,700 | $8,900 | $45,800 |
| 2016 | $3,751 | $65,200 | $17,500 | $47,700 |
| 2015 | $3,738 | $65,200 | $17,500 | $47,700 |
| 2014 | $3,720 | $65,200 | $17,500 | $47,700 |
Source: Public Records
Map
Nearby Homes