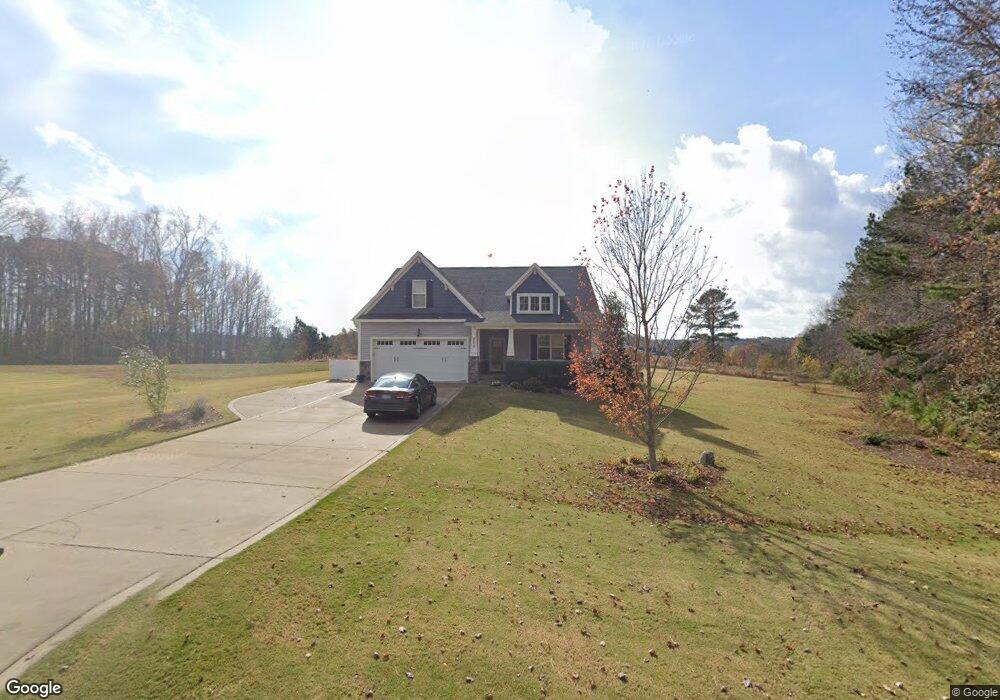
213 Carsons Creek Trail Wendell, NC 27591
Wilders NeighborhoodEstimated Value: $501,000 - $529,000
3
Beds
3
Baths
2,360
Sq Ft
$219/Sq Ft
Est. Value
About This Home
This home is located at 213 Carsons Creek Trail, Wendell, NC 27591 and is currently estimated at $517,562, approximately $219 per square foot. 213 Carsons Creek Trail is a home located in Johnston County with nearby schools including Archer Lodge Middle School and Corinth Holders High School.
Ownership History
Date
Name
Owned For
Owner Type
Purchase Details
Closed on
Aug 12, 2020
Sold by
Parker Donald E and Parker Lynn A
Bought by
Mcfadden Chad Allen and Mcfadden Maria
Current Estimated Value
Home Financials for this Owner
Home Financials are based on the most recent Mortgage that was taken out on this home.
Original Mortgage
$319,500
Outstanding Balance
$283,419
Interest Rate
3%
Mortgage Type
New Conventional
Estimated Equity
$234,143
Purchase Details
Closed on
Feb 7, 2017
Sold by
Weaver Homes Inc
Bought by
Parker Donald E and Parker Lynn A
Home Financials for this Owner
Home Financials are based on the most recent Mortgage that was taken out on this home.
Original Mortgage
$269,123
Interest Rate
4.32%
Mortgage Type
New Conventional
Purchase Details
Closed on
Aug 8, 2016
Sold by
Weaver Development Co Inc
Bought by
Weaver Homes Inc
Create a Home Valuation Report for This Property
The Home Valuation Report is an in-depth analysis detailing your home's value as well as a comparison with similar homes in the area
Home Values in the Area
Average Home Value in this Area
Purchase History
| Date | Buyer | Sale Price | Title Company |
|---|---|---|---|
| Mcfadden Chad Allen | $355,000 | None Available | |
| Parker Donald E | $283,500 | -- | |
| Weaver Homes Inc | $42,000 | None Available |
Source: Public Records
Mortgage History
| Date | Status | Borrower | Loan Amount |
|---|---|---|---|
| Open | Mcfadden Chad Allen | $319,500 | |
| Previous Owner | Parker Donald E | $269,123 |
Source: Public Records
Tax History Compared to Growth
Tax History
| Year | Tax Paid | Tax Assessment Tax Assessment Total Assessment is a certain percentage of the fair market value that is determined by local assessors to be the total taxable value of land and additions on the property. | Land | Improvement |
|---|---|---|---|---|
| 2025 | $2,902 | $457,060 | $90,000 | $367,060 |
| 2024 | $2,432 | $300,190 | $57,600 | $242,590 |
| 2023 | $2,432 | $300,190 | $57,600 | $242,590 |
| 2022 | $2,462 | $300,190 | $57,600 | $242,590 |
| 2021 | $2,462 | $300,190 | $57,600 | $242,590 |
| 2020 | $2,552 | $300,190 | $57,600 | $242,590 |
| 2019 | $2,552 | $300,190 | $57,600 | $242,590 |
| 2018 | $2,054 | $236,100 | $32,400 | $203,700 |
| 2017 | $879 | $103,400 | $32,400 | $71,000 |
| 2016 | $275 | $32,400 | $32,400 | $0 |
Source: Public Records
Map
Nearby Homes
- 54 Silverleaf Dr
- The Garner Plan at Mulhollem
- The Smithfield Plan at Mulhollem
- The Selma Plan at Mulhollem
- The Clayton Plan at Mulhollem
- The Guilford Plan at Mulhollem
- The Holly Plan at Mulhollem
- The Raleigh Plan at Mulhollem
- The Cary Plan at Mulhollem
- The Apex Plan at Mulhollem
- 73 Merle Way
- 72 Merle Way
- 89 Merle Way
- 280 Mulhollem Dr
- 92 Mulhollem Dr
- 90 Merle Way
- 46 Mulhollem Dr
- 70 Mulhollem Dr
- 15 Merle Dr
- 256 Mulhollem Dr
- 241 Carsons Creek Trail
- 167 Carsons Creek Trail Unit Lot 47
- 190 Carsons Creek Trail Unit Lot 5
- 250 Carsons Creek Trail Unit Lot 6
- 273 Carsons Creek Trail Unit Lot 44
- 38 Chapman Ct
- 355 Prestwood Ln
- 39 Chapman Ct
- 301 Carsons Creek Trail
- 348 Prestwood Ln
- 43 Overcup Ct
- 142 Carsons Creek Trail Unit Lot 4
- 142 Carsons Creek Trail
- 349 Prestwood Ln
- 34 Chapman Ct
- 308 Carsons Creek Trail
- 329 Carsons Creek Trail Unit 42
- 329 Carsons Creek Trail
- 33 Chapman Ct
- 37 Overcup Ct