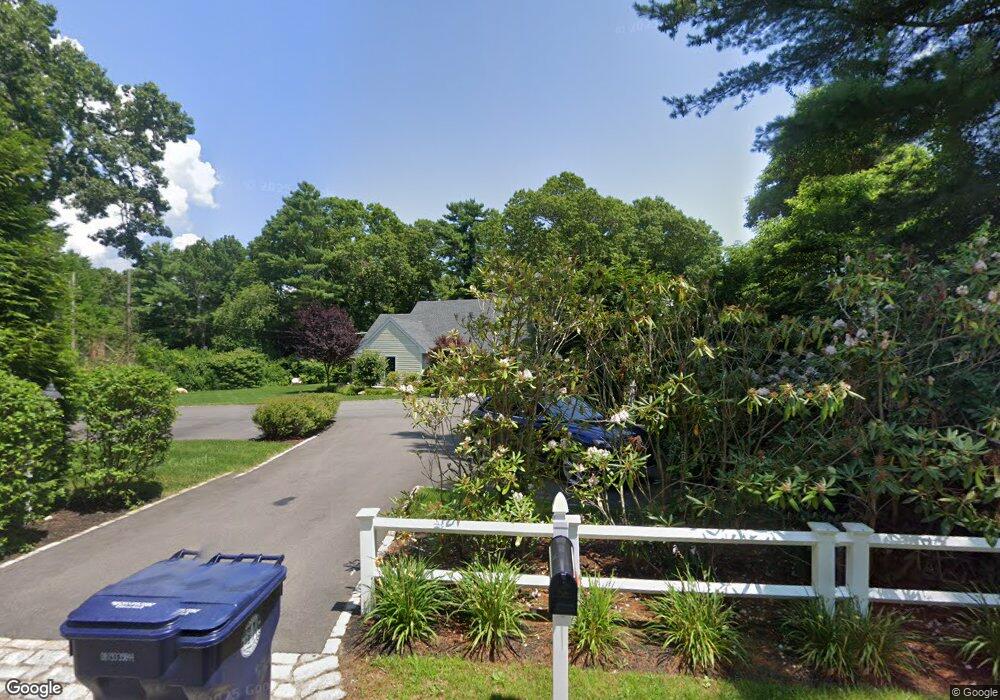
213 Converse Rd Marion, MA 02738
Marion Center NeighborhoodEstimated Value: $1,185,000 - $1,953,000
5
Beds
3
Baths
3,400
Sq Ft
$486/Sq Ft
Est. Value
About This Home
This home is located at 213 Converse Rd, Marion, MA 02738 and is currently estimated at $1,651,133, approximately $485 per square foot. 213 Converse Rd is a home located in Plymouth County with nearby schools including Old Rochester Regional High School and Tabor Academy.
Ownership History
Date
Name
Owned For
Owner Type
Purchase Details
Closed on
Dec 16, 2016
Sold by
Turnbull Porter V and Turnbull-Lynch Zora
Bought by
22 Cove Street Llc
Current Estimated Value
Purchase Details
Closed on
Mar 15, 2016
Sold by
Jeannette Z Turnbull I
Bought by
Turnbull Porter V
Purchase Details
Closed on
Oct 28, 2010
Sold by
Turnbull Jeannette Z
Bought by
Jeannette Z Turnbull I
Create a Home Valuation Report for This Property
The Home Valuation Report is an in-depth analysis detailing your home's value as well as a comparison with similar homes in the area
Home Values in the Area
Average Home Value in this Area
Purchase History
| Date | Buyer | Sale Price | Title Company |
|---|---|---|---|
| 22 Cove Street Llc | $850,000 | -- | |
| Turnbull Porter V | -- | -- | |
| Jeannette Z Turnbull I | -- | -- |
Source: Public Records
Tax History
| Year | Tax Paid | Tax Assessment Tax Assessment Total Assessment is a certain percentage of the fair market value that is determined by local assessors to be the total taxable value of land and additions on the property. | Land | Improvement |
|---|---|---|---|---|
| 2025 | $10,296 | $1,104,700 | $275,000 | $829,700 |
| 2024 | $9,985 | $1,078,300 | $275,000 | $803,300 |
| 2023 | $9,200 | $974,600 | $243,900 | $730,700 |
| 2022 | $9,707 | $894,700 | $183,800 | $710,900 |
| 2021 | $9,715 | $858,200 | $193,500 | $664,700 |
| 2020 | $9,874 | $843,900 | $212,300 | $631,600 |
| 2019 | $9,308 | $843,900 | $212,300 | $631,600 |
| 2018 | $7,141 | $623,700 | $219,200 | $404,500 |
| 2017 | $6,701 | $587,300 | $219,200 | $368,100 |
| 2016 | $6,642 | $587,300 | $219,200 | $368,100 |
| 2015 | $6,848 | $616,400 | $209,900 | $406,500 |
Source: Public Records
Map
Nearby Homes
Your Personal Tour Guide
Ask me questions while you tour the home.