
$1,350
- 3 Beds
- 1 Bath
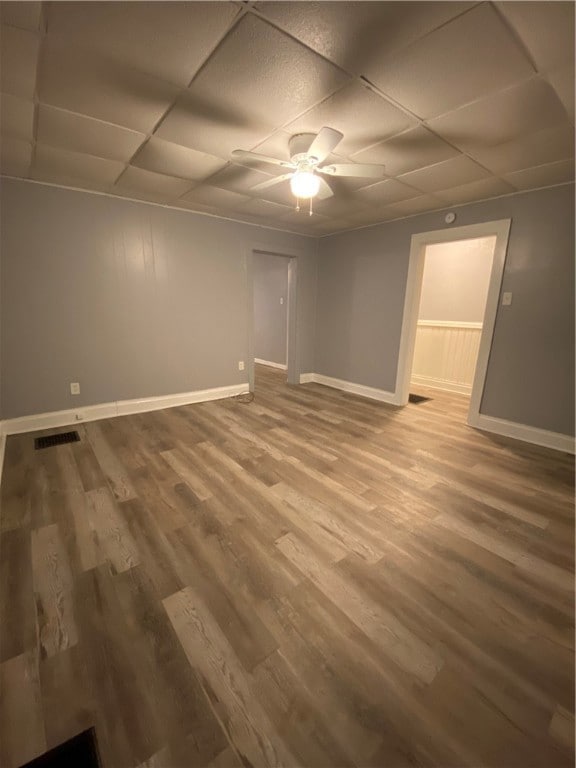
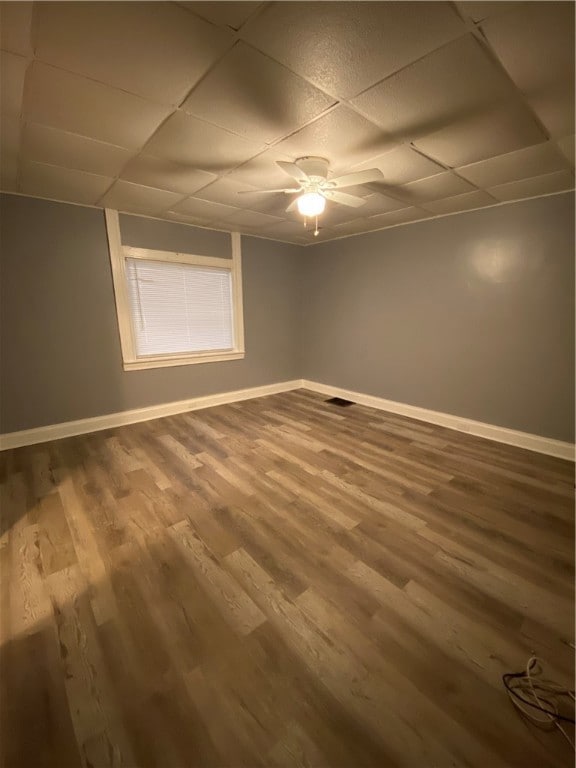
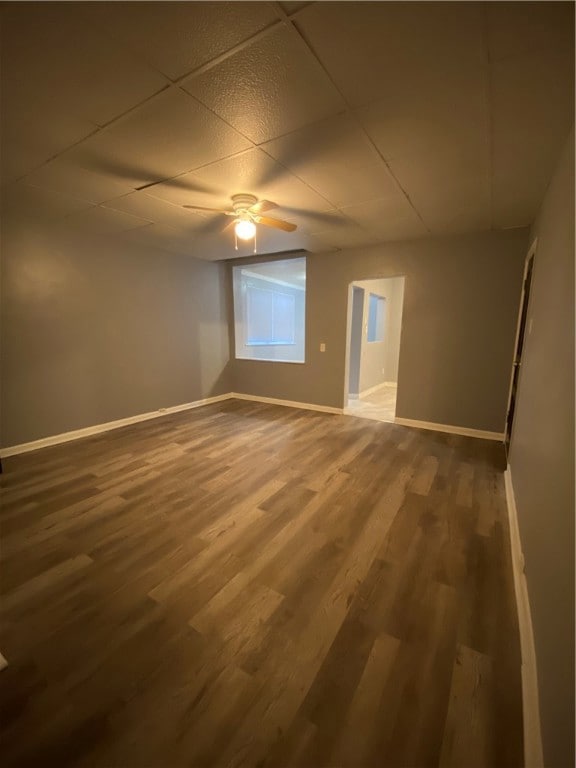
- 1,302 Sq Ft
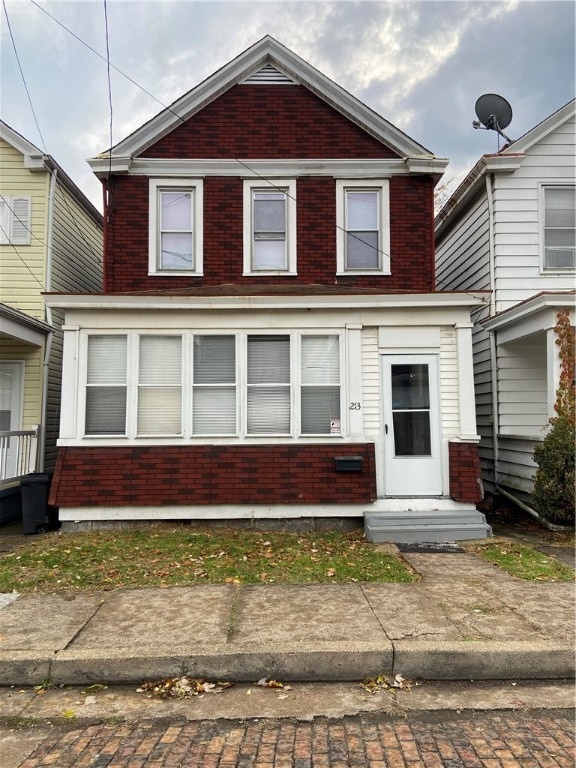
- 1614 Myler St
- Pittsburgh, PA
Bad Credit is OK. Here are STRICT REQUIREMENTS to qualify:(1) Deposit of $1,350.00 1st month , & security deposit $1,350.00 x 2=$2,700)(2) Good Rental History & Must be able to get landlord reference(3) No Evictions & Clean Criminal History(4) Proof of Income & Good Job History making minimum of $4,050+ a month after taxes(5) NO SECTION 8(6) Must Pay $50 per applicant for
Chris Ivory KELLER WILLIAMS REALTY