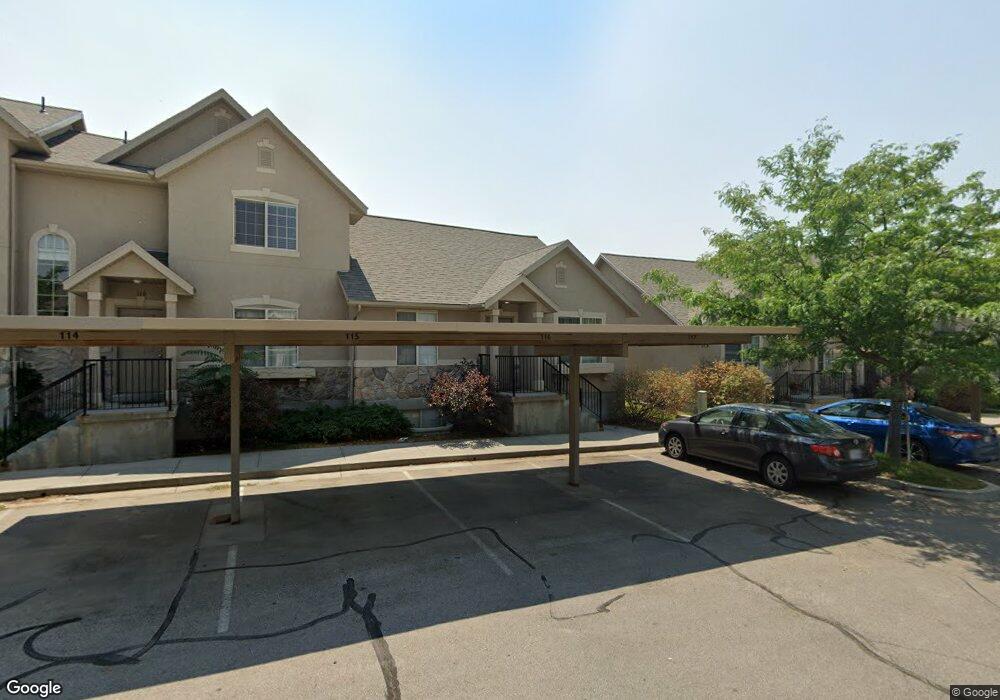
213 Crescent View Ln Tooele, UT 84074
Estimated Value: $306,000 - $340,000
--
Bed
--
Bath
2,030
Sq Ft
$161/Sq Ft
Est. Value
About This Home
This home is located at 213 Crescent View Ln, Tooele, UT 84074 and is currently estimated at $326,239, approximately $160 per square foot. 213 Crescent View Ln is a home located in Tooele County with nearby schools including Copper Canyon Elementary School, Clarke N. Johnsen Junior High School, and Stansbury High School.
Ownership History
Date
Name
Owned For
Owner Type
Purchase Details
Closed on
Jun 16, 2011
Sold by
The Secretary Of Hud
Bought by
Scribner Russell G and Scribner Kari Nina
Current Estimated Value
Home Financials for this Owner
Home Financials are based on the most recent Mortgage that was taken out on this home.
Original Mortgage
$72,600
Outstanding Balance
$50,049
Interest Rate
4.63%
Mortgage Type
New Conventional
Estimated Equity
$276,190
Purchase Details
Closed on
Nov 1, 2010
Sold by
Strum Gary
Bought by
Sonyador Llc
Purchase Details
Closed on
Jul 1, 2010
Sold by
Wells Fargo Bank Na
Bought by
The Secretary Of Hud
Purchase Details
Closed on
Oct 29, 2009
Sold by
Atkins Jared B
Bought by
Wells Fargo Bank Na
Purchase Details
Closed on
Jan 17, 2008
Sold by
Atkins Jared B and Atkins Amanda S
Bought by
Atkins Jared B
Home Financials for this Owner
Home Financials are based on the most recent Mortgage that was taken out on this home.
Original Mortgage
$154,280
Interest Rate
6.07%
Mortgage Type
FHA
Create a Home Valuation Report for This Property
The Home Valuation Report is an in-depth analysis detailing your home's value as well as a comparison with similar homes in the area
Home Values in the Area
Average Home Value in this Area
Purchase History
| Date | Buyer | Sale Price | Title Company |
|---|---|---|---|
| Scribner Russell G | -- | Monument Title Insurance Inc | |
| Sonyador Llc | -- | Charger Title | |
| The Secretary Of Hud | -- | None Available | |
| Wells Fargo Bank Na | -- | Etitle Insurance Age | |
| Atkins Jared B | -- | United Title Services |
Source: Public Records
Mortgage History
| Date | Status | Borrower | Loan Amount |
|---|---|---|---|
| Open | Scribner Russell G | $72,600 | |
| Previous Owner | Atkins Jared B | $154,280 |
Source: Public Records
Tax History Compared to Growth
Tax History
| Year | Tax Paid | Tax Assessment Tax Assessment Total Assessment is a certain percentage of the fair market value that is determined by local assessors to be the total taxable value of land and additions on the property. | Land | Improvement |
|---|---|---|---|---|
| 2025 | $2,008 | $167,498 | $16,502 | $150,996 |
| 2024 | $2,901 | $169,840 | $55,000 | $114,840 |
| 2023 | $2,901 | $157,490 | $36,300 | $121,190 |
| 2022 | $1,541 | $132,607 | $41,250 | $91,357 |
| 2021 | $1,388 | $99,914 | $13,750 | $86,164 |
| 2020 | $1,331 | $166,137 | $25,000 | $141,137 |
| 2019 | $1,308 | $160,570 | $17,284 | $143,286 |
| 2018 | $1,156 | $134,629 | $20,000 | $114,629 |
| 2017 | $899 | $124,208 | $20,000 | $104,208 |
| 2016 | $904 | $65,585 | $11,000 | $54,585 |
| 2015 | $904 | $65,774 | $0 | $0 |
| 2014 | -- | $65,774 | $0 | $0 |
Source: Public Records
Map
Nearby Homes
- 223 Crescent View Ln Unit 126
- 23 W 1160 N Unit 14
- 231 W 1160 N Unit 13
- 231 W 1160 N Unit 16
- 231 W 1160 N Unit 15
- 234 W Crescent Ln Unit 99
- 241 W 1160 N Unit 17
- 241 W 1160 N Unit 19
- 241 W 1160 N Unit 18
- 251 W 1160 N Unit 23
- 251 W 1160 N Unit 22
- Red Sox Plan at Prosperity at Overlake - Priority Homes
- The Harker Plan at Prosperity at Overlake
- Cottonwood Plan at Prosperity at Overlake
- The Millcreek Plan at Prosperity at Overlake
- Phillies Plan at Prosperity at Overlake - Priority Homes
- Cubs Plan at Prosperity at Overlake - Priority Homes
- Willow Plan at Prosperity at Overlake
- Rangers Plan at Prosperity at Overlake - Priority Homes
- Pine Plan at Prosperity at Overlake
- 213 Crescent View Ln
- 213 Crescent View Ln
- 213 Crescent View Ln
- 213 Crescent View Ln Unit 119
- 213 Crescent View Ln Unit 118
- 213 W Crescent Ln N Unit 118
- 213 W Crescent Ln N Unit 121
- 213 Crescent View Ln Unit 120
- 203 W Crescent View Ln
- 202 W 1160 N
- 202 W 1160 N Unit 137
- 202 W 1160 N Unit 136
- 202 W 1160 N
- 202 W 1160 N Unit 138
- 202 W 1160 N Unit 135
- 212 W 1160 N
- 212 W 1160 N
- 212 W 1160 N
- 212 W 1160 N Unit 132
- 203 Crescent View Ln