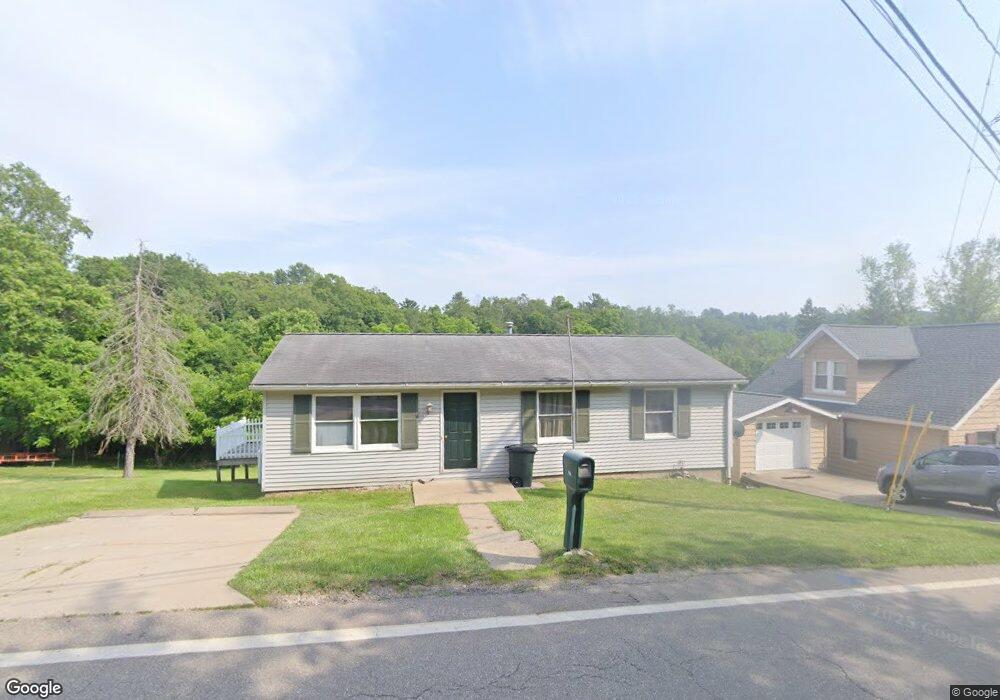
213 Depot St Flushing, OH 43977
Estimated Value: $86,000 - $149,000
3
Beds
1
Bath
1,008
Sq Ft
$119/Sq Ft
Est. Value
About This Home
This home is located at 213 Depot St, Flushing, OH 43977 and is currently estimated at $119,488, approximately $118 per square foot. 213 Depot St is a home located in Belmont County with nearby schools including Union Local Elementary School, Union Local Middle School, and Union Local High School.
Ownership History
Date
Name
Owned For
Owner Type
Purchase Details
Closed on
Dec 30, 2024
Sold by
Osovich Michael J and Osovich Katherine S
Bought by
Diversified Real Estate Services Of Ohio Llc
Current Estimated Value
Purchase Details
Closed on
Jun 24, 2009
Sold by
Fannie Mae
Bought by
Osovich Kathy
Purchase Details
Closed on
Jul 22, 2008
Sold by
Mckelvey Jessica and Hsbc Bank Usa Na
Bought by
Federal National Mortgage Association
Purchase Details
Closed on
Apr 4, 2007
Sold by
Phillips Robin M
Bought by
Mckelvey Jessica
Home Financials for this Owner
Home Financials are based on the most recent Mortgage that was taken out on this home.
Original Mortgage
$51,900
Interest Rate
6.25%
Mortgage Type
Purchase Money Mortgage
Purchase Details
Closed on
Apr 29, 1998
Sold by
Thrash Beverly M
Bought by
Thrash Beverly M
Purchase Details
Closed on
Jan 1, 1986
Sold by
Thrash Charles Jeffrey E
Bought by
Thrash Charles Jeffrey E
Create a Home Valuation Report for This Property
The Home Valuation Report is an in-depth analysis detailing your home's value as well as a comparison with similar homes in the area
Home Values in the Area
Average Home Value in this Area
Purchase History
| Date | Buyer | Sale Price | Title Company |
|---|---|---|---|
| Diversified Real Estate Services Of Ohio Llc | -- | None Listed On Document | |
| Osovich Kathy | $14,000 | Belmont Title Inc | |
| Federal National Mortgage Association | $22,000 | None Available | |
| Mckelvey Jessica | $51,900 | Reserve Title Agency Inc | |
| Thrash Beverly M | -- | -- | |
| Thrash Charles Jeffrey E | -- | -- |
Source: Public Records
Mortgage History
| Date | Status | Borrower | Loan Amount |
|---|---|---|---|
| Previous Owner | Mckelvey Jessica | $51,900 |
Source: Public Records
Tax History Compared to Growth
Tax History
| Year | Tax Paid | Tax Assessment Tax Assessment Total Assessment is a certain percentage of the fair market value that is determined by local assessors to be the total taxable value of land and additions on the property. | Land | Improvement |
|---|---|---|---|---|
| 2024 | $1,448 | $37,820 | $2,050 | $35,770 |
| 2023 | $1,200 | $29,230 | $1,750 | $27,480 |
| 2022 | $1,200 | $29,221 | $1,746 | $27,475 |
| 2021 | $1,196 | $29,221 | $1,746 | $27,475 |
| 2020 | $1,108 | $25,410 | $1,520 | $23,890 |
| 2019 | $1,111 | $25,410 | $1,520 | $23,890 |
| 2018 | $1,106 | $25,410 | $1,520 | $23,890 |
| 2017 | $950 | $22,370 | $1,650 | $20,720 |
| 2016 | $955 | $22,370 | $1,650 | $20,720 |
| 2015 | $978 | $22,370 | $1,650 | $20,720 |
| 2014 | $892 | $20,000 | $1,500 | $18,500 |
| 2013 | $871 | $20,000 | $1,500 | $18,500 |
Source: Public Records
Map
Nearby Homes
- 117 A&B High St
- 0 Pearl St
- 203 Morristown Flushing Rd
- 0 Holloway Rd State Rt 331 Unit 5067951
- 72018 Uniontown Flushing Rd
- 42921 Harrah St
- 77900 Slater Rd
- 41091 Nicki Lynn Dr
- 70835 Bannock Uniontown Rd
- 38400 Cadiz-Piedmont Rd
- 40900 Havenwood Dr
- INLOT 19 Havenwood
- 73310 Hazelwood Hills Rd
- 67380 National New Lafferty Rd
- 34683 Sunshine Rd
- 34810 Nelson Dr
- 67290 National New Lafferty Rd
- 19 acres Saffell Rd
- 15 acres Saffell Rd
- 35 acres Saffell Rd