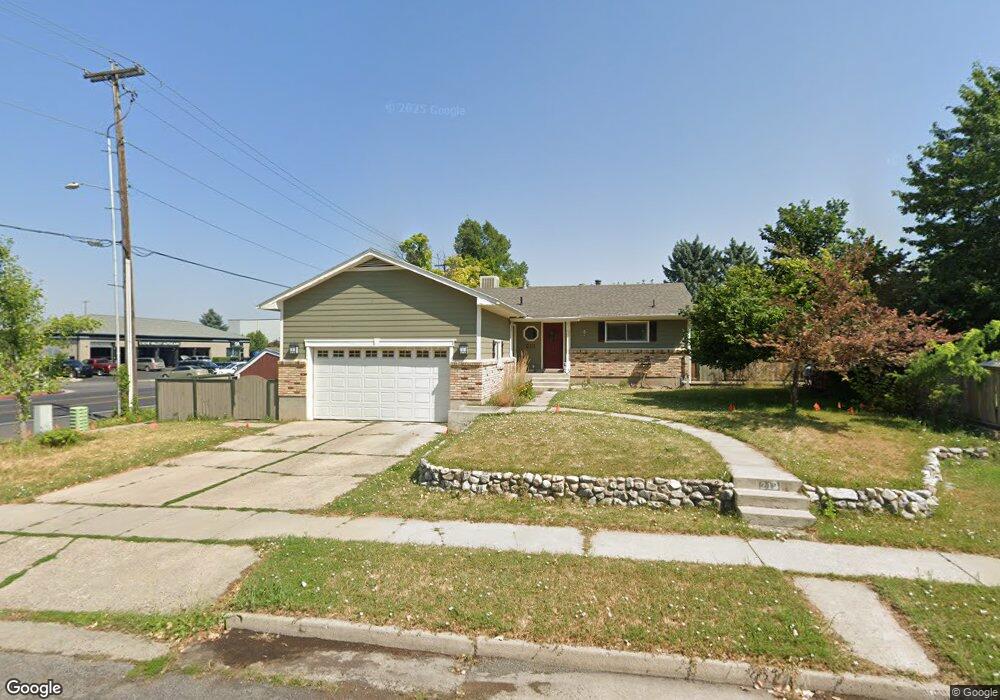
213 E 1100 N Logan, UT 84341
Adams NeighborhoodEstimated Value: $392,000 - $481,000
5
Beds
2
Baths
2,068
Sq Ft
$204/Sq Ft
Est. Value
About This Home
This home is located at 213 E 1100 N, Logan, UT 84341 and is currently estimated at $422,784, approximately $204 per square foot. 213 E 1100 N is a home located in Cache County with nearby schools including Adams Elementary School, Mount Logan Middle School, and Logan High School.
Ownership History
Date
Name
Owned For
Owner Type
Purchase Details
Closed on
Nov 18, 2019
Sold by
Choate David M and Choate Marilyn C
Bought by
Hole Chelsea and Moore Matthew
Current Estimated Value
Home Financials for this Owner
Home Financials are based on the most recent Mortgage that was taken out on this home.
Original Mortgage
$240,800
Outstanding Balance
$210,953
Interest Rate
3.5%
Estimated Equity
$211,831
Purchase Details
Closed on
Jun 13, 2019
Sold by
Choate David M and Choate Marilyn C
Bought by
Choate David M and Choate Marilyn C
Home Financials for this Owner
Home Financials are based on the most recent Mortgage that was taken out on this home.
Original Mortgage
$135,000
Interest Rate
4.1%
Mortgage Type
Credit Line Revolving
Purchase Details
Closed on
Sep 3, 2010
Sold by
Choate David M and Choate Marilyn C
Bought by
Choate David M and Choate Marilyn C
Create a Home Valuation Report for This Property
The Home Valuation Report is an in-depth analysis detailing your home's value as well as a comparison with similar homes in the area
Home Values in the Area
Average Home Value in this Area
Purchase History
| Date | Buyer | Sale Price | Title Company |
|---|---|---|---|
| Hole Chelsea | -- | Cache Title Logan | |
| Choate David M | -- | First American Title | |
| Choate David M | -- | None Available |
Source: Public Records
Mortgage History
| Date | Status | Borrower | Loan Amount |
|---|---|---|---|
| Open | Hole Chelsea | $240,800 | |
| Previous Owner | Choate David M | $135,000 |
Source: Public Records
Tax History
| Year | Tax Paid | Tax Assessment Tax Assessment Total Assessment is a certain percentage of the fair market value that is determined by local assessors to be the total taxable value of land and additions on the property. | Land | Improvement |
|---|---|---|---|---|
| 2025 | $1,835 | $237,350 | $0 | $0 |
| 2024 | $1,895 | $237,350 | $0 | $0 |
| 2023 | $1,976 | $235,975 | $0 | $0 |
| 2022 | $1,746 | $194,725 | $0 | $0 |
| 2021 | $16 | $283,880 | $50,000 | $233,880 |
| 2020 | $1,580 | $244,900 | $50,000 | $194,900 |
| 2019 | $1,568 | $232,512 | $50,000 | $182,512 |
| 2018 | $1,511 | $204,672 | $50,000 | $154,672 |
| 2017 | $1,383 | $99,055 | $0 | $0 |
| 2016 | $1,434 | $85,580 | $0 | $0 |
| 2015 | $1,241 | $85,580 | $0 | $0 |
| 2014 | $1,085 | $82,815 | $0 | $0 |
| 2013 | -- | $82,815 | $0 | $0 |
Source: Public Records
Map
Nearby Homes
Your Personal Tour Guide
Ask me questions while you tour the home.