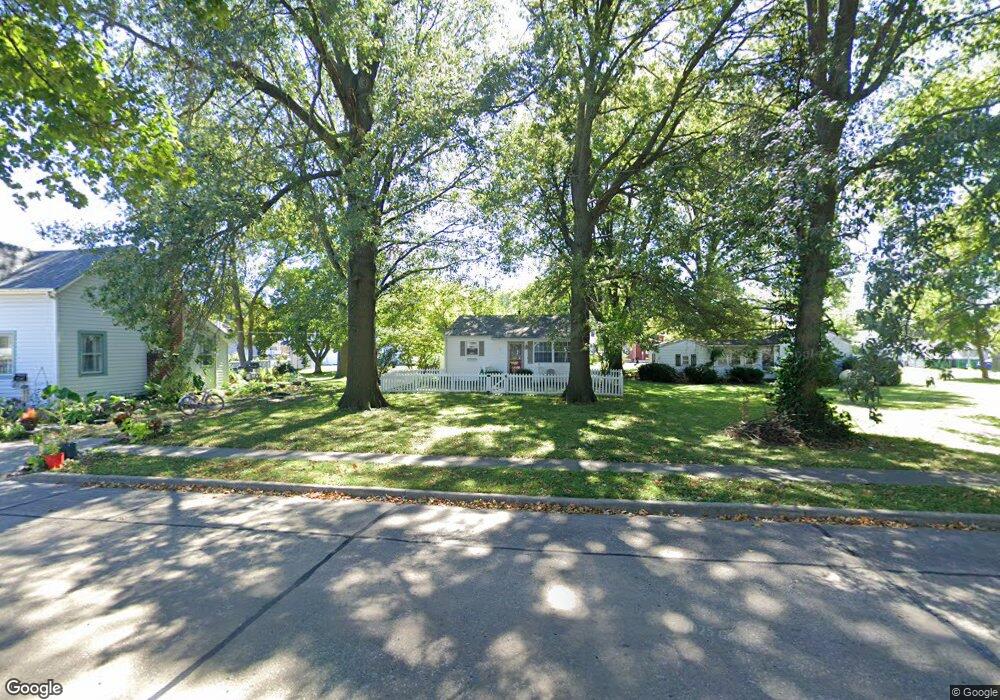
213 E 3rd St O Fallon, IL 62269
Estimated Value: $122,000 - $128,138
Studio
--
Bath
672
Sq Ft
$188/Sq Ft
Est. Value
About This Home
This home is located at 213 E 3rd St, O Fallon, IL 62269 and is currently estimated at $126,035, approximately $187 per square foot. 213 E 3rd St is a home located in St. Clair County with nearby schools including Kampmeyer Elementary School, Carriel Junior High School, and O'Fallon Township High School.
Ownership History
Date
Name
Owned For
Owner Type
Purchase Details
Closed on
Jul 2, 2007
Sold by
Blaylock Tim and Redick Courtney
Bought by
Bauer Dawn M
Current Estimated Value
Home Financials for this Owner
Home Financials are based on the most recent Mortgage that was taken out on this home.
Original Mortgage
$76,000
Outstanding Balance
$47,179
Interest Rate
6.37%
Mortgage Type
Purchase Money Mortgage
Estimated Equity
$78,856
Purchase Details
Closed on
Mar 22, 2006
Sold by
Hacker Megan C
Bought by
Blaylock Tim and Redick Courtney
Home Financials for this Owner
Home Financials are based on the most recent Mortgage that was taken out on this home.
Original Mortgage
$71,000
Interest Rate
6.37%
Mortgage Type
Fannie Mae Freddie Mac
Purchase Details
Closed on
Aug 9, 2001
Sold by
M&J Leasing Llc
Bought by
Hacker Megan C
Home Financials for this Owner
Home Financials are based on the most recent Mortgage that was taken out on this home.
Original Mortgage
$54,512
Interest Rate
7.15%
Mortgage Type
FHA
Create a Home Valuation Report for This Property
The Home Valuation Report is an in-depth analysis detailing your home's value as well as a comparison with similar homes in the area
Home Values in the Area
Average Home Value in this Area
Purchase History
| Date | Buyer | Sale Price | Title Company |
|---|---|---|---|
| Bauer Dawn M | $76,000 | Benedick Title Ins | |
| Blaylock Tim | $71,000 | Netco | |
| Hacker Megan C | $55,000 | -- |
Source: Public Records
Mortgage History
| Date | Status | Borrower | Loan Amount |
|---|---|---|---|
| Open | Bauer Dawn M | $76,000 | |
| Previous Owner | Blaylock Tim | $71,000 | |
| Previous Owner | Hacker Megan C | $54,512 |
Source: Public Records
Tax History
| Year | Tax Paid | Tax Assessment Tax Assessment Total Assessment is a certain percentage of the fair market value that is determined by local assessors to be the total taxable value of land and additions on the property. | Land | Improvement |
|---|---|---|---|---|
| 2024 | $2,208 | $30,295 | $4,393 | $25,902 |
| 2023 | $2,037 | $26,888 | $3,899 | $22,989 |
| 2022 | $1,927 | $24,720 | $3,585 | $21,135 |
| 2021 | $1,709 | $21,532 | $3,597 | $17,935 |
| 2020 | $1,698 | $20,382 | $3,405 | $16,977 |
| 2019 | $1,661 | $20,382 | $3,405 | $16,977 |
| 2018 | $1,619 | $19,790 | $3,306 | $16,484 |
| 2017 | $1,715 | $20,218 | $3,447 | $16,771 |
| 2016 | $1,710 | $19,747 | $3,367 | $16,380 |
| 2014 | $1,584 | $19,519 | $3,328 | $16,191 |
| 2013 | $822 | $19,833 | $3,276 | $16,557 |
Source: Public Records
Map
Nearby Homes
- 205 E 2nd St
- 311 E 2nd St
- 212 W 4th St
- 408 E Washington St
- 204 W State St
- 201 W Washington St
- 308 S Smiley St
- 206 Westwood Dr
- 415 W 3rd St
- 303 N Cedar St
- 418 W 3rd St
- 425 W 3rd St
- 421 W Highway 50
- 504 Fontainebleau
- 202 Whitehall Dr
- 903 Dale Ave
- 507 W 4th St
- 308 Mulberry Ln
- 104 W Jackson St
- 604 N Smiley St
Your Personal Tour Guide
Ask me questions while you tour the home.