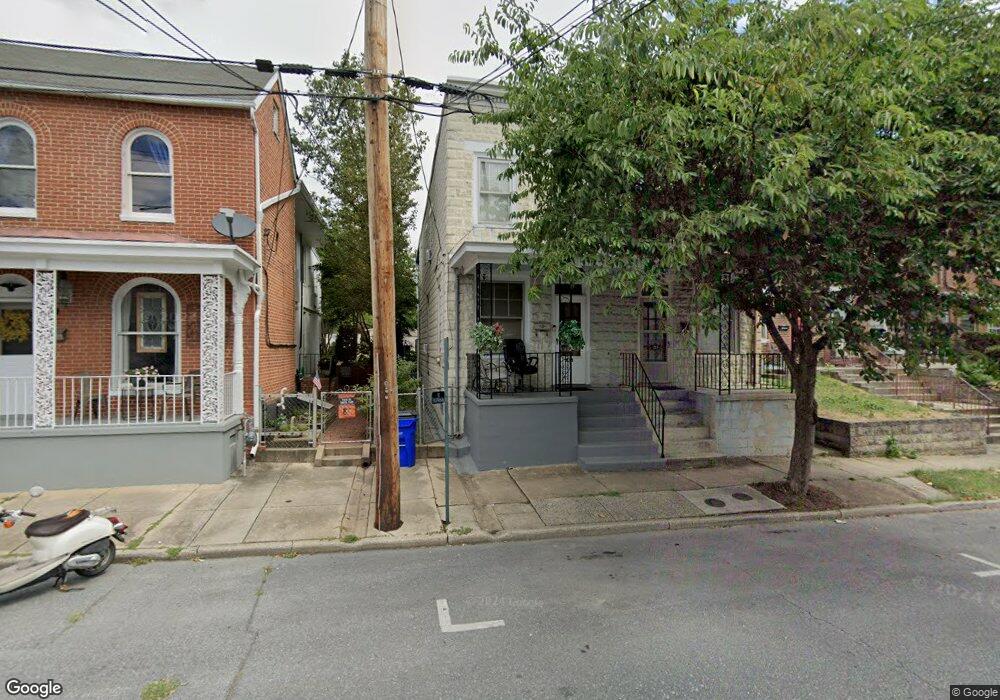
213 E 5th St Frederick, MD 21701
Downtown Frederick NeighborhoodEstimated Value: $305,636 - $365,000
Studio
1
Bath
1,148
Sq Ft
$285/Sq Ft
Est. Value
About This Home
This home is located at 213 E 5th St, Frederick, MD 21701 and is currently estimated at $327,159, approximately $284 per square foot. 213 E 5th St is a home located in Frederick County with nearby schools including Spring Ridge Elementary School, Gov. Thomas Johnson Middle School, and Gov. Thomas Johnson High School.
Ownership History
Date
Name
Owned For
Owner Type
Purchase Details
Closed on
Nov 7, 1984
Sold by
Md. Holding & Management Co. Inc.
Bought by
Wilburn Donald R and Wilburn Vicky L
Current Estimated Value
Purchase Details
Closed on
Apr 5, 1984
Sold by
Houff M Ruth
Bought by
Md. Holding & Management Co. Inc.
Home Financials for this Owner
Home Financials are based on the most recent Mortgage that was taken out on this home.
Original Mortgage
$20,000
Interest Rate
13.55%
Create a Home Valuation Report for This Property
The Home Valuation Report is an in-depth analysis detailing your home's value as well as a comparison with similar homes in the area
Home Values in the Area
Average Home Value in this Area
Purchase History
| Date | Buyer | Sale Price | Title Company |
|---|---|---|---|
| Wilburn Donald R | $41,000 | -- | |
| Md. Holding & Management Co. Inc. | $30,000 | -- |
Source: Public Records
Mortgage History
| Date | Status | Borrower | Loan Amount |
|---|---|---|---|
| Previous Owner | Md. Holding & Management Co. Inc. | $20,000 |
Source: Public Records
Tax History
| Year | Tax Paid | Tax Assessment Tax Assessment Total Assessment is a certain percentage of the fair market value that is determined by local assessors to be the total taxable value of land and additions on the property. | Land | Improvement |
|---|---|---|---|---|
| 2025 | $3,088 | $230,400 | $144,400 | $86,000 |
| 2024 | $3,088 | $208,000 | -- | -- |
| 2023 | $2,854 | $185,600 | $0 | $0 |
| 2022 | $2,704 | $163,200 | $101,700 | $61,500 |
| 2021 | $2,453 | $155,700 | $0 | $0 |
| 2020 | $2,453 | $148,200 | $0 | $0 |
| 2019 | $2,339 | $140,700 | $84,400 | $56,300 |
| 2018 | $2,258 | $140,100 | $0 | $0 |
| 2017 | $2,140 | $140,700 | $0 | $0 |
| 2016 | $1,741 | $138,900 | $0 | $0 |
| 2015 | $1,741 | $138,900 | $0 | $0 |
| 2014 | $1,741 | $138,900 | $0 | $0 |
Source: Public Records
Map
Nearby Homes
- 229 E 5th St
- 224 E 6th St
- 418 N Maxwell Ave
- 20 Maxwell Square
- 104 E 7th St
- 15 E 4th St
- 20 E 7th St
- 8 W 7th St
- 8 1/2 W 5th St
- 232 E 2nd St
- 208 E 2nd St Unit 202
- 208 E 2nd St Unit 402
- 210 E 2nd St Unit 402
- 210 E 2nd St Unit 401
- 311 Cheyenne Dr
- 515 E Church St
- 103 E 8th St Unit F
- 13 E 2nd St
- 338 E Church St
- 17 W 3rd St
Your Personal Tour Guide
Ask me questions while you tour the home.