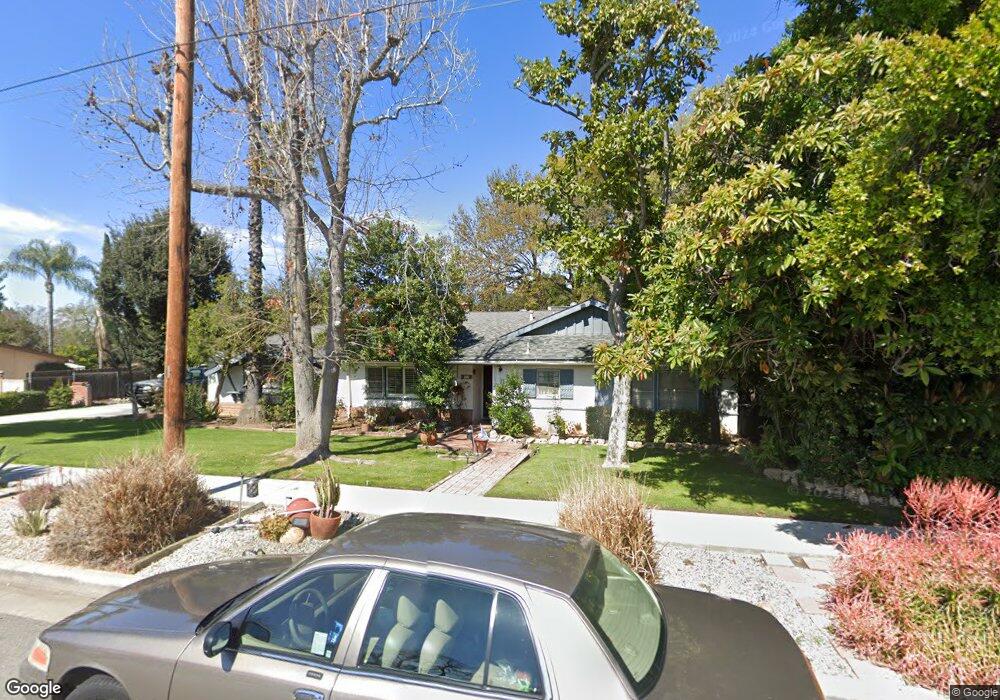
213 E South Ave Redlands, CA 92373
South Redlands NeighborhoodEstimated Value: $775,000 - $900,000
About This Home
This home is located at 213 E South Ave, Redlands, CA 92373 and is currently estimated at $841,179, approximately $348 per square foot. 213 E South Ave is a home located in San Bernardino County with nearby schools including Kimberly Elementary School, Moore Middle School, and Redlands Senior High School.
Ownership History
We collect this data history from publicly available records. To have your information removed, we recommend requesting removal directly through your county’s website.
Purchase Details
Home Financials for this Owner
Home Financials are based on the most recent Mortgage that was taken out on this home.Purchase Details
Home Values in the Area
Average Home Value in this Area
Purchase History
We collect this data history from publicly available records. To have your information removed, we recommend requesting removal directly through your county’s website.
| Date | Buyer | Sale Price | Title Company |
|---|---|---|---|
| -- | Lawyers Title | ||
| -- | Lawyers Title | ||
| -- | -- |
Mortgage History
We collect this data history from publicly available records. To have your information removed, we recommend requesting removal directly through your county’s website.
| Date | Status | Borrower | Loan Amount |
|---|---|---|---|
| Closed | $106,000 | ||
| Closed | $200,000 | ||
| Closed | $199,000 | ||
| Closed | $35,250 |
Tax History
We collect this data history from publicly available records. To have your information removed, we recommend requesting removal directly through your county’s website.
| Year | Tax Paid | Tax Assessment Tax Assessment Total Assessment is a certain percentage of the fair market value that is determined by local assessors to be the total taxable value of land and additions on the property. | Land | Improvement |
|---|---|---|---|---|
| 2026 | $3,805 | $310,704 | $59,741 | $250,963 |
| 2025 | $3,805 | $304,612 | $58,570 | $246,042 |
| 2024 | $3,554 | $298,640 | $57,422 | $241,218 |
| 2023 | $3,550 | $292,784 | $56,296 | $236,488 |
| 2022 | $3,498 | $287,043 | $55,192 | $231,851 |
| 2021 | $3,562 | $281,415 | $54,110 | $227,305 |
| 2020 | $3,509 | $278,529 | $53,555 | $224,974 |
| 2019 | $3,411 | $273,068 | $52,505 | $220,563 |
| 2018 | $3,327 | $267,713 | $51,475 | $216,238 |
| 2017 | $3,299 | $262,464 | $50,466 | $211,998 |
| 2016 | $3,262 | $257,317 | $49,476 | $207,841 |
| 2015 | $3,238 | $253,452 | $48,733 | $204,719 |
| 2014 | $3,180 | $248,487 | $47,778 | $200,709 |
Map
- 1555 Lynne Ct
- 230 E Sunset Dr N
- 329 E South Ave
- 1525 Garden St
- 1510 Pamela Crescent
- 1615 Halsey St
- 0 Garden St Unit EV23054640
- 505 Marilyn Ln
- 352 Campbell Ave
- 21 W Hilton Ave
- 1688 Dwight St
- 1702 Dwight St
- 530 W Sunset Dr
- 613 E Sunset Dr N
- 1710 Fairmont Dr
- 1804 Valle Vista Dr
- 0 Campbell Ave
- 1550 Marion Rd
- 1464 Pacific St
- 724 W Sunset Dr
- 209 E South Ave
- 217 E South Ave
- 214 Belmont Ct
- 210 Belmont Ct
- 218 Belmont Ct
- 212 E South Ave
- 205 E South Ave
- 221 E South Ave
- 216 E South Ave
- 208 E South Ave
- 206 Belmont Ct
- 222 Belmont Ct
- 220 E South Ave
- 1516 Lynne Ct
- 204 E South Ave
- 1513 Lynne Ct
- 201 E South Ave
- 1518 Lynne Ct
- 215 Belmont Ct
- 219 Belmont Ct
Ask me questions while you tour the home.