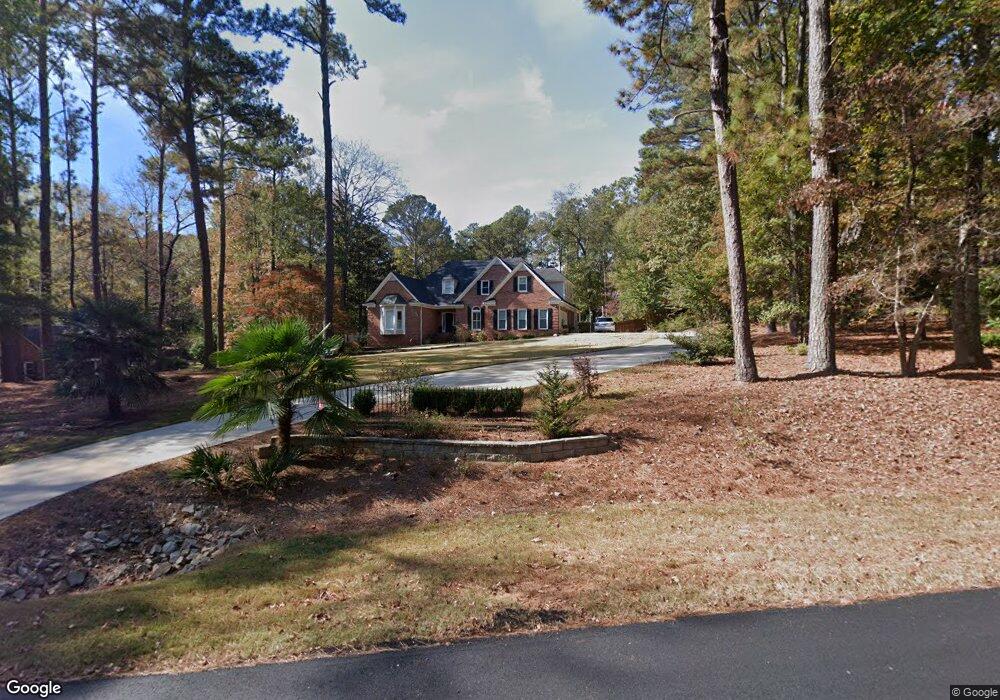
213 E Yorktown Dr Lagrange, GA 30240
Estimated Value: $494,272 - $652,000
4
Beds
3
Baths
3,858
Sq Ft
$143/Sq Ft
Est. Value
About This Home
This home is located at 213 E Yorktown Dr, Lagrange, GA 30240 and is currently estimated at $551,568, approximately $142 per square foot. 213 E Yorktown Dr is a home located in Troup County with nearby schools including Franklin Forest Elementary School, Hillcrest Elementary School, and Hollis Hand Elementary School.
Ownership History
Date
Name
Owned For
Owner Type
Purchase Details
Closed on
Dec 1, 2017
Sold by
Brown Robert S
Bought by
Gong Jeffery Allan and Gong Steven Ray
Current Estimated Value
Home Financials for this Owner
Home Financials are based on the most recent Mortgage that was taken out on this home.
Original Mortgage
$158,500
Outstanding Balance
$130,968
Interest Rate
3.94%
Mortgage Type
New Conventional
Estimated Equity
$420,600
Purchase Details
Closed on
Jun 18, 2003
Sold by
Robert S Brown Jr Interest
Bought by
Brown Robert S and Brown Deborah H
Purchase Details
Closed on
Jun 14, 1994
Sold by
Hendrix Daniel T
Bought by
Robert S Brown Jr Interest
Purchase Details
Closed on
Jan 1, 1986
Sold by
Ruth Berford and Ruth Kirk
Bought by
Hendrix Daniel T
Purchase Details
Closed on
Dec 6, 1983
Sold by
Phillips S H
Bought by
Ruth Berford and Ruth Kirk
Create a Home Valuation Report for This Property
The Home Valuation Report is an in-depth analysis detailing your home's value as well as a comparison with similar homes in the area
Purchase History
| Date | Buyer | Sale Price | Title Company |
|---|---|---|---|
| Gong Jeffery Allan | $308,500 | -- | |
| Brown Robert S | -- | -- | |
| Robert S Brown Jr Interest | $190,000 | -- | |
| Hendrix Daniel T | $16,500 | -- | |
| Ruth Berford | -- | -- |
Source: Public Records
Mortgage History
| Date | Status | Borrower | Loan Amount |
|---|---|---|---|
| Open | Gong Jeffery Allan | $158,500 |
Source: Public Records
Tax History
| Year | Tax Paid | Tax Assessment Tax Assessment Total Assessment is a certain percentage of the fair market value that is determined by local assessors to be the total taxable value of land and additions on the property. | Land | Improvement |
|---|---|---|---|---|
| 2025 | $5,231 | $203,120 | $18,000 | $185,120 |
| 2024 | $4,825 | $176,920 | $18,000 | $158,920 |
| 2023 | $4,844 | $177,600 | $18,000 | $159,600 |
| 2022 | $4,619 | $165,480 | $18,000 | $147,480 |
| 2021 | $3,827 | $126,880 | $12,000 | $114,880 |
| 2020 | $3,827 | $126,880 | $12,000 | $114,880 |
| 2019 | $3,769 | $124,960 | $12,000 | $112,960 |
| 2018 | $3,156 | $106,640 | $13,200 | $93,440 |
| 2017 | $3,156 | $106,640 | $13,200 | $93,440 |
| 2016 | $3,056 | $103,312 | $13,200 | $90,112 |
| 2015 | $3,061 | $103,312 | $13,200 | $90,112 |
| 2014 | $2,923 | $98,570 | $13,200 | $85,370 |
| 2013 | -- | $95,424 | $13,200 | $82,224 |
Source: Public Records
Map
Nearby Homes
- 219 E Yorktown Dr
- 64 Waterview Ct
- 0 Waterview Dr Unit 10558462
- 206 Sturbridge Dr
- 111 Copper Creek Dr
- 120 Copper Creek Dr
- 135 Copper Creek Dr
- 24 N Brooks Rd
- 178 Waterview Dr
- 130 Sunny Point Cir
- 110 Pond View Point
- 103 Woodchase
- 109 Windridge
- 107 Windridge
- 114 Taylor Len Dr
- 107 Cameron Pointe Dr
- 103 Windridge
- 113 Wellington Dr
- 102 Cameron Pointe Dr
- 209 River Oaks Dr
- 211 E Yorktown Dr
- 215 E Yorktown Dr
- E E Yorktown Dr
- 314 W Yorktown Dr
- 209 E Yorktown Dr
- 316 W Yorktown Dr
- 217 E Yorktown Dr
- 214 E Yorktown Dr
- 310 W Yorktown Dr
- 212 E Yorktown Dr
- W W Yorktown Dr Unit 49
- W W Yorktown Dr
- 318 W Yorktown Dr
- 207 E Yorktown Dr
- 216 E Yorktown Dr
- 210 E Yorktown Dr
- 308 W Yorktown Dr
- 315 W Yorktown Dr
- 208 E Yorktown Dr
- 313 W Yorktown Dr
Your Personal Tour Guide
Ask me questions while you tour the home.