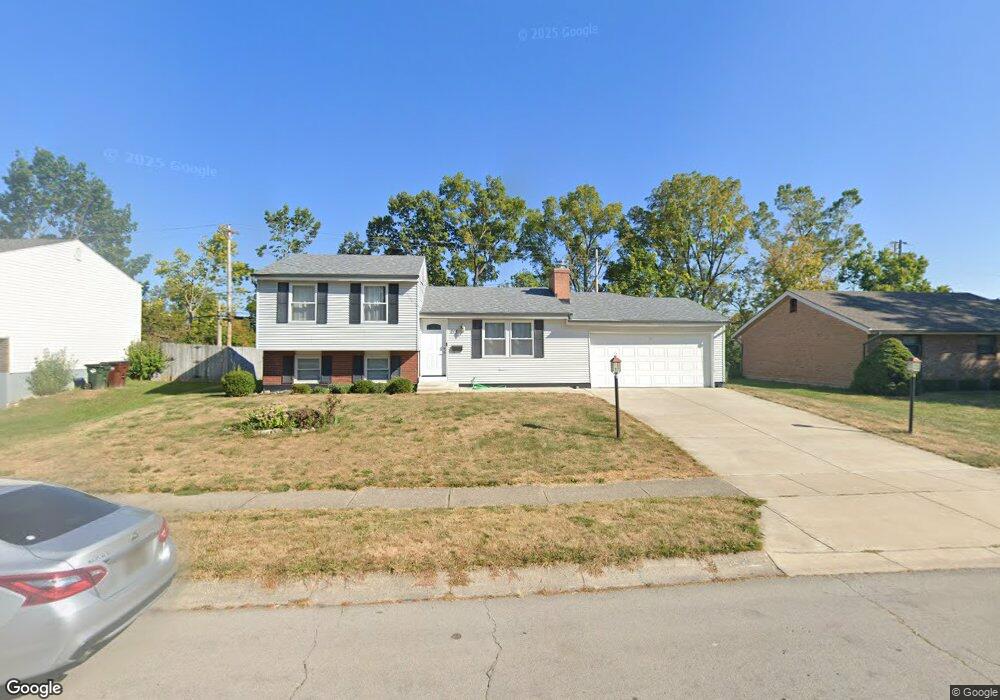
213 Eller Ave Englewood, OH 45322
Estimated Value: $202,000 - $238,637
4
Beds
3
Baths
1,768
Sq Ft
$121/Sq Ft
Est. Value
About This Home
This home is located at 213 Eller Ave, Englewood, OH 45322 and is currently estimated at $214,659, approximately $121 per square foot. 213 Eller Ave is a home located in Montgomery County with nearby schools including Northmont High School, Trotwood Preparatory & Fitness Academy, and Imagine Schools - Woodbury Academy.
Ownership History
Date
Name
Owned For
Owner Type
Purchase Details
Closed on
Dec 1, 2016
Sold by
Singh Jaswinder
Bought by
Singh Narinder and Singh Sonia A
Current Estimated Value
Home Financials for this Owner
Home Financials are based on the most recent Mortgage that was taken out on this home.
Original Mortgage
$52,410
Outstanding Balance
$42,255
Interest Rate
3.47%
Mortgage Type
Seller Take Back
Estimated Equity
$172,404
Purchase Details
Closed on
May 29, 2015
Sold by
Martin Dianna L and Sopiwnik Dianna L
Bought by
Singh Jaswinder
Purchase Details
Closed on
Jul 8, 2004
Sold by
Silko James W
Bought by
Sopiwnik Dianna L
Home Financials for this Owner
Home Financials are based on the most recent Mortgage that was taken out on this home.
Original Mortgage
$99,120
Interest Rate
6.42%
Mortgage Type
Purchase Money Mortgage
Create a Home Valuation Report for This Property
The Home Valuation Report is an in-depth analysis detailing your home's value as well as a comparison with similar homes in the area
Home Values in the Area
Average Home Value in this Area
Purchase History
| Date | Buyer | Sale Price | Title Company |
|---|---|---|---|
| Singh Narinder | -- | Sterling Title | |
| Singh Jaswinder | $75,000 | Sterling Title Inc | |
| Sopiwnik Dianna L | $123,900 | -- |
Source: Public Records
Mortgage History
| Date | Status | Borrower | Loan Amount |
|---|---|---|---|
| Open | Singh Narinder | $52,410 | |
| Previous Owner | Sopiwnik Dianna L | $99,120 |
Source: Public Records
Tax History Compared to Growth
Tax History
| Year | Tax Paid | Tax Assessment Tax Assessment Total Assessment is a certain percentage of the fair market value that is determined by local assessors to be the total taxable value of land and additions on the property. | Land | Improvement |
|---|---|---|---|---|
| 2024 | $3,576 | $62,720 | $9,570 | $53,150 |
| 2023 | $3,576 | $62,720 | $9,570 | $53,150 |
| 2022 | $3,267 | $44,100 | $6,740 | $37,360 |
| 2021 | $3,277 | $44,100 | $6,740 | $37,360 |
| 2020 | $3,216 | $44,100 | $6,740 | $37,360 |
| 2019 | $2,725 | $33,460 | $7,750 | $25,710 |
| 2018 | $2,676 | $33,460 | $7,750 | $25,710 |
| 2017 | $2,657 | $33,460 | $7,750 | $25,710 |
| 2016 | $2,627 | $31,690 | $6,740 | $24,950 |
| 2015 | $2,408 | $31,690 | $6,740 | $24,950 |
| 2014 | $2,408 | $31,690 | $6,740 | $24,950 |
| 2012 | -- | $35,980 | $7,410 | $28,570 |
Source: Public Records
Map
Nearby Homes
- 803 Albert St
- 520 S Main St
- 104 Silverstone Dr
- 717 Woodlawn Ave
- 109 Silverstone Dr
- 607 Albert St
- 206 Lodestone Dr
- 718 Bonnycastle Ave
- 108 Tate Ave
- 510 Rohr Ln
- 510 Lambert Ln
- 208 S Walnut St
- 534 Unger Ave
- 1010 Heathwood Dr
- 123 Chestnut St
- 505 Durst Dr
- 916 S Main St
- 1017 Terracewood Dr
- 1008 Merrywood Dr
- 108 Denwood Trail
- 211 Eller Ave
- 215 Eller Ave
- 217 Eller Ave
- 201 Northeast Cir
- 214 Eller Ave
- 216 Eller Ave
- 203 Northeast Cir
- 218 Eller Ave
- 219 Eller Ave
- 220 Eller Ave
- 205 Northeast Cir
- 809 Sipos Cir
- 221 Eller Ave
- 222 Eller Ave
- 200 Northeast Cir
- 807 Sipos Cir
- 811 Sipos Cir
- 805 Sipos Cir
- 207 Northeast Cir
- 202 Northeast Cir