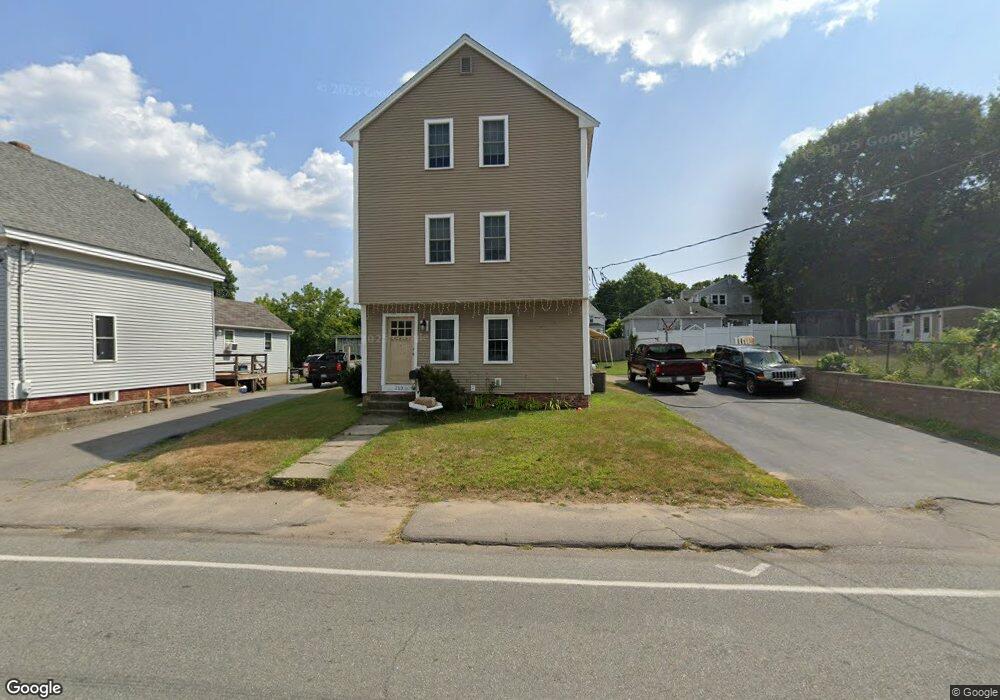
213 Elliot St Brockton, MA 02302
Estimated Value: $529,000 - $668,000
3
Beds
2
Baths
2,267
Sq Ft
$265/Sq Ft
Est. Value
About This Home
This home is located at 213 Elliot St, Brockton, MA 02302 and is currently estimated at $599,657, approximately $264 per square foot. 213 Elliot St is a home located in Plymouth County with nearby schools including Brookfield Elementary School, Downey Elementary School, and Ashfield Middle School.
Ownership History
Date
Name
Owned For
Owner Type
Purchase Details
Closed on
Jul 1, 1998
Sold by
Department Of Housing & Urban Dev
Bought by
Melo Mariano C
Current Estimated Value
Home Financials for this Owner
Home Financials are based on the most recent Mortgage that was taken out on this home.
Original Mortgage
$67,545
Outstanding Balance
$13,871
Interest Rate
7.04%
Mortgage Type
Purchase Money Mortgage
Estimated Equity
$585,786
Purchase Details
Closed on
May 8, 1997
Sold by
Barros Clarence J
Bought by
Norwest Mtg Inc
Purchase Details
Closed on
Dec 28, 1990
Sold by
Lang Dorothy
Bought by
Barros Clarence J
Home Financials for this Owner
Home Financials are based on the most recent Mortgage that was taken out on this home.
Original Mortgage
$91,135
Interest Rate
9.96%
Mortgage Type
Purchase Money Mortgage
Create a Home Valuation Report for This Property
The Home Valuation Report is an in-depth analysis detailing your home's value as well as a comparison with similar homes in the area
Home Values in the Area
Average Home Value in this Area
Purchase History
| Date | Buyer | Sale Price | Title Company |
|---|---|---|---|
| Melo Mariano C | $63,100 | -- | |
| Norwest Mtg Inc | $108,783 | -- | |
| Barros Clarence J | $92,000 | -- |
Source: Public Records
Mortgage History
| Date | Status | Borrower | Loan Amount |
|---|---|---|---|
| Open | Barros Clarence J | $67,545 | |
| Previous Owner | Barros Clarence J | $91,135 |
Source: Public Records
Tax History Compared to Growth
Tax History
| Year | Tax Paid | Tax Assessment Tax Assessment Total Assessment is a certain percentage of the fair market value that is determined by local assessors to be the total taxable value of land and additions on the property. | Land | Improvement |
|---|---|---|---|---|
| 2025 | $6,024 | $497,400 | $140,700 | $356,700 |
| 2024 | $5,723 | $476,100 | $140,700 | $335,400 |
| 2023 | $5,809 | $447,500 | $107,600 | $339,900 |
| 2022 | $5,370 | $384,400 | $97,800 | $286,600 |
| 2021 | $5,471 | $377,300 | $82,000 | $295,300 |
| 2020 | $4,244 | $280,100 | $76,100 | $204,000 |
| 2019 | $4,232 | $272,300 | $74,000 | $198,300 |
| 2018 | $3,883 | $241,800 | $74,000 | $167,800 |
| 2017 | $3,965 | $246,300 | $74,000 | $172,300 |
| 2016 | $2,906 | $167,400 | $72,000 | $95,400 |
| 2015 | $2,301 | $126,800 | $72,000 | $54,800 |
| 2014 | $2,487 | $137,200 | $72,000 | $65,200 |
Source: Public Records
Map
Nearby Homes