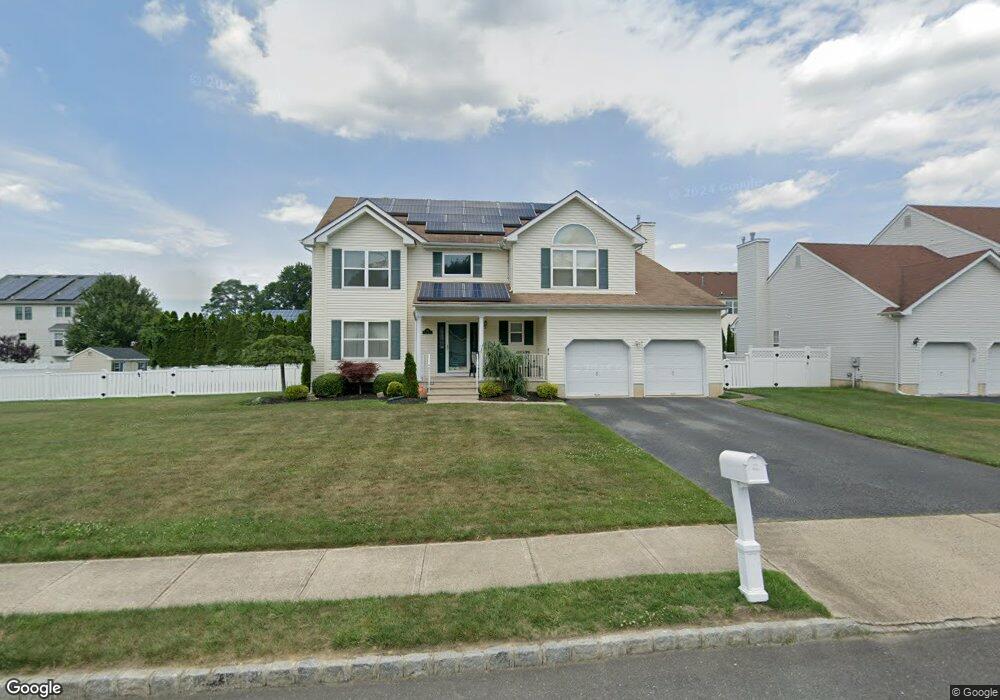
213 Fairway Ln Neptune, NJ 07753
Estimated Value: $685,000 - $834,000
4
Beds
2
Baths
2,404
Sq Ft
$313/Sq Ft
Est. Value
About This Home
This home is located at 213 Fairway Ln, Neptune, NJ 07753 and is currently estimated at $753,403, approximately $313 per square foot. 213 Fairway Ln is a home located in Monmouth County with nearby schools including Neptune High School, Our Lady of Mount Carmel School, and Ilan High School.
Ownership History
Date
Name
Owned For
Owner Type
Purchase Details
Closed on
Sep 29, 2006
Sold by
Sirva Relocation Llc
Bought by
Parrish Sheridan and Sheridan Jacquelyn
Current Estimated Value
Home Financials for this Owner
Home Financials are based on the most recent Mortgage that was taken out on this home.
Original Mortgage
$399,100
Outstanding Balance
$238,282
Interest Rate
6.47%
Estimated Equity
$515,121
Purchase Details
Closed on
Jul 8, 2006
Sold by
Carton Brian A
Bought by
Sirva Relocation Llc
Home Financials for this Owner
Home Financials are based on the most recent Mortgage that was taken out on this home.
Original Mortgage
$399,100
Interest Rate
6.5%
Mortgage Type
Adjustable Rate Mortgage/ARM
Purchase Details
Closed on
Oct 9, 2003
Sold by
Fairways At Heritage
Bought by
Carton Brian and Carton Kathleen
Home Financials for this Owner
Home Financials are based on the most recent Mortgage that was taken out on this home.
Original Mortgage
$100,000
Interest Rate
5.62%
Create a Home Valuation Report for This Property
The Home Valuation Report is an in-depth analysis detailing your home's value as well as a comparison with similar homes in the area
Home Values in the Area
Average Home Value in this Area
Purchase History
| Date | Buyer | Sale Price | Title Company |
|---|---|---|---|
| Parrish Sheridan | $499,000 | -- | |
| Sirva Relocation Llc | $499,000 | -- | |
| Carton Brian | $325,900 | -- |
Source: Public Records
Mortgage History
| Date | Status | Borrower | Loan Amount |
|---|---|---|---|
| Open | Parrish Sheridan | $399,100 | |
| Previous Owner | Sirva Relocation Llc | $399,100 | |
| Previous Owner | Carton Brian | $100,000 |
Source: Public Records
Tax History Compared to Growth
Tax History
| Year | Tax Paid | Tax Assessment Tax Assessment Total Assessment is a certain percentage of the fair market value that is determined by local assessors to be the total taxable value of land and additions on the property. | Land | Improvement |
|---|---|---|---|---|
| 2025 | $9,940 | $647,900 | $273,900 | $374,000 |
| 2024 | $8,851 | $567,700 | $200,500 | $367,200 |
| 2023 | $8,851 | $490,100 | $127,000 | $363,100 |
| 2022 | $8,425 | $479,300 | $116,300 | $363,000 |
| 2021 | $8,425 | $398,700 | $116,300 | $282,400 |
| 2020 | $8,332 | $393,400 | $116,300 | $277,100 |
| 2019 | $8,069 | $376,200 | $116,300 | $259,900 |
| 2018 | $8,185 | $377,200 | $116,300 | $260,900 |
| 2017 | $7,972 | $352,900 | $111,300 | $241,600 |
| 2016 | $8,136 | $359,200 | $102,800 | $256,400 |
| 2015 | $7,919 | $355,600 | $102,800 | $252,800 |
| 2014 | $8,804 | $325,000 | $77,800 | $247,200 |
Source: Public Records
Map
Nearby Homes
- 216 Fairway Ln
- 2 Kenneth Terrace
- 725 Gail Dr
- 4 White Dr
- 8 Norman Dr
- 1 Alfred Ct
- 3 Manor Dr
- 9 Hillview Dr
- 2 Squirrel Rd
- 22 Phoebe Dr
- 2 Carol Ave
- 1100 Green Grove Rd
- 35 Shorebrook Cir
- 116 Moss Place
- 634 Wayside Rd
- 636 Wayside Rd
- 8 Knox Blvd
- 1961 Jumping Brook Rd
- 224 Cold Indian Springs Rd Unit B
- 309 Deal Ave
- 211 Fairway Ln
- 215 Fairway Ln
- 201 Fairway Ln
- 222 Fairway Ln
- 205 Fairway Ln
- 224 Fairway Ln
- 209 Fairway Ln
- 207 Fairway Ln
- 202 Fairway Ln
- 220 Fairway Ln
- 204 Fairway Ln
- 200 Fairway Ln
- 806 Green Grove Rd
- 808 Green Grove Rd
- 804 Green Grove Rd
- 800 Green Grove Rd
- 218 Fairway Ln
- 206 Fairway Ln
- 807 Ruth Dr
- 732 Green Grove Rd