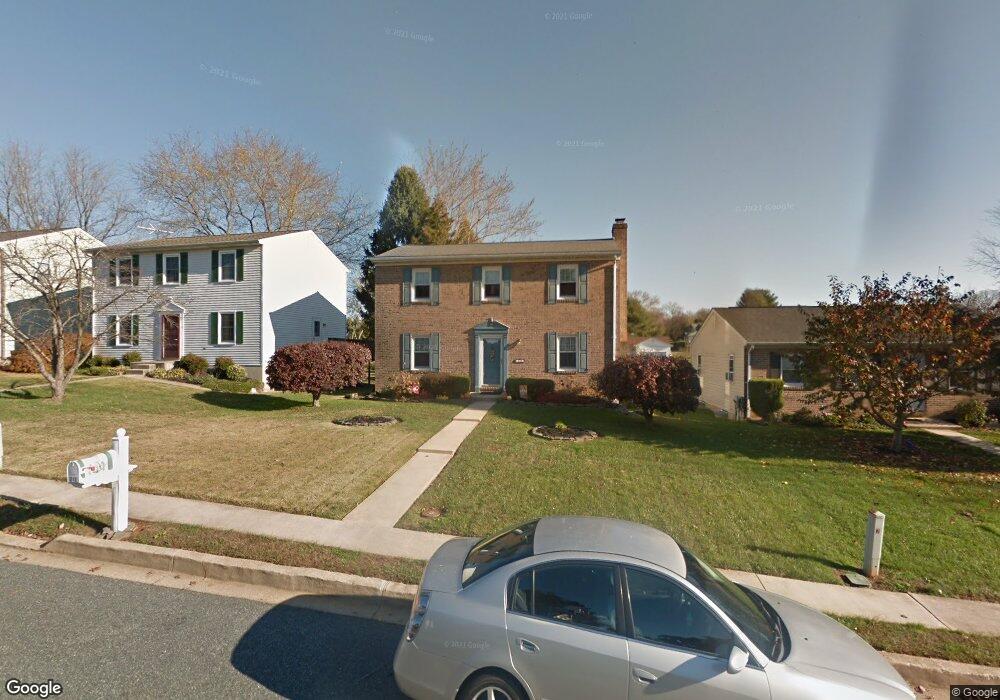
213 Farm Rd Aberdeen, MD 21001
Estimated Value: $293,000 - $377,000
--
Bed
3
Baths
1,680
Sq Ft
$201/Sq Ft
Est. Value
About This Home
This home is located at 213 Farm Rd, Aberdeen, MD 21001 and is currently estimated at $338,402, approximately $201 per square foot. 213 Farm Rd is a home located in Harford County with nearby schools including Halls Cross Roads Elementary School, Aberdeen Middle School, and Aberdeen High School.
Ownership History
Date
Name
Owned For
Owner Type
Purchase Details
Closed on
Jan 21, 1986
Sold by
Fradel James Edward
Bought by
Mcgrath Patrick J and Mc Grath Julie R
Current Estimated Value
Home Financials for this Owner
Home Financials are based on the most recent Mortgage that was taken out on this home.
Original Mortgage
$72,600
Interest Rate
10.99%
Purchase Details
Closed on
Jun 30, 1982
Sold by
Jack Leroy A T
Bought by
Fradel James Edward
Home Financials for this Owner
Home Financials are based on the most recent Mortgage that was taken out on this home.
Original Mortgage
$43,105
Interest Rate
16.73%
Create a Home Valuation Report for This Property
The Home Valuation Report is an in-depth analysis detailing your home's value as well as a comparison with similar homes in the area
Home Values in the Area
Average Home Value in this Area
Purchase History
| Date | Buyer | Sale Price | Title Company |
|---|---|---|---|
| Mcgrath Patrick J | $71,900 | -- | |
| Fradel James Edward | $59,500 | -- |
Source: Public Records
Mortgage History
| Date | Status | Borrower | Loan Amount |
|---|---|---|---|
| Closed | Mcgrath Patrick J | $72,600 | |
| Previous Owner | Fradel James Edward | $43,105 |
Source: Public Records
Tax History Compared to Growth
Tax History
| Year | Tax Paid | Tax Assessment Tax Assessment Total Assessment is a certain percentage of the fair market value that is determined by local assessors to be the total taxable value of land and additions on the property. | Land | Improvement |
|---|---|---|---|---|
| 2025 | $1,784 | $245,567 | $0 | $0 |
| 2024 | $1,673 | $230,733 | $0 | $0 |
| 2023 | $1,673 | $215,900 | $60,400 | $155,500 |
| 2022 | $2,323 | $213,100 | $0 | $0 |
| 2021 | $2,637 | $210,300 | $0 | $0 |
| 2020 | $171 | $207,500 | $60,400 | $147,100 |
| 2019 | $1,667 | $201,533 | $0 | $0 |
| 2018 | $1,603 | $195,567 | $0 | $0 |
| 2017 | $1,890 | $189,600 | $0 | $0 |
| 2016 | -- | $189,600 | $0 | $0 |
| 2015 | $2,042 | $189,600 | $0 | $0 |
| 2014 | $2,042 | $199,500 | $0 | $0 |
Source: Public Records
Map
Nearby Homes