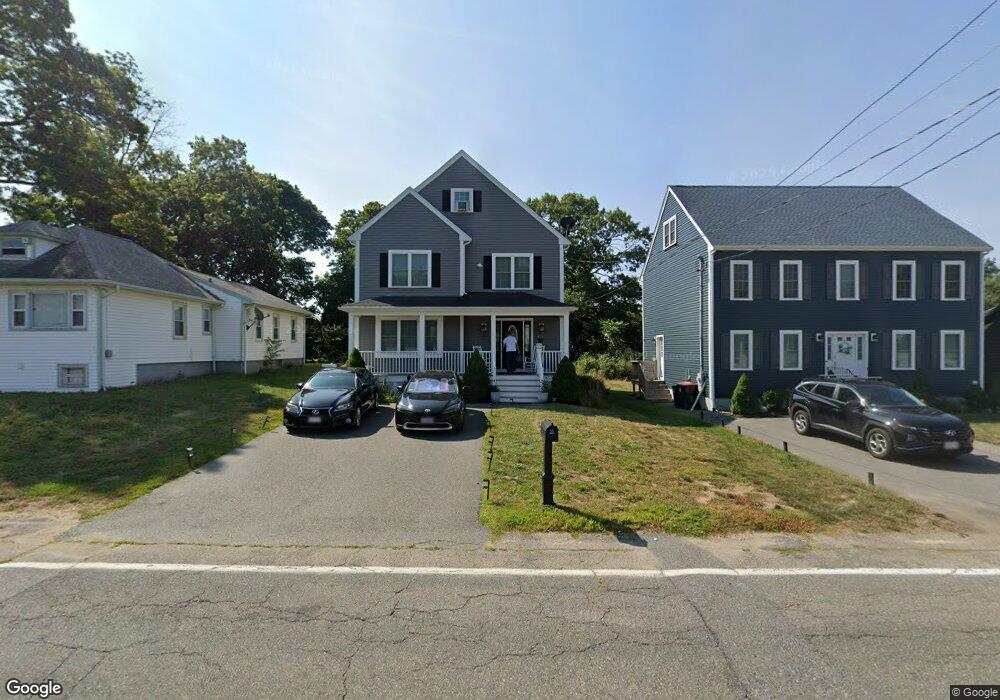
213 Field St Brockton, MA 02302
Montello NeighborhoodEstimated Value: $717,296 - $773,000
4
Beds
3
Baths
2,590
Sq Ft
$288/Sq Ft
Est. Value
About This Home
This home is located at 213 Field St, Brockton, MA 02302 and is currently estimated at $746,574, approximately $288 per square foot. 213 Field St is a home with nearby schools including Brookfield Elementary School, Mary E. Baker Elementary School, and Downey Elementary School.
Ownership History
Date
Name
Owned For
Owner Type
Purchase Details
Closed on
Aug 24, 2018
Sold by
Rosy Realty Llc
Bought by
Rosario Miguel and Rosario Ilidia
Current Estimated Value
Home Financials for this Owner
Home Financials are based on the most recent Mortgage that was taken out on this home.
Original Mortgage
$433,200
Outstanding Balance
$376,217
Interest Rate
4.5%
Mortgage Type
New Conventional
Estimated Equity
$370,357
Purchase Details
Closed on
Apr 26, 2018
Sold by
Fortin Joseph A
Bought by
Rosy Realty Llc
Create a Home Valuation Report for This Property
The Home Valuation Report is an in-depth analysis detailing your home's value as well as a comparison with similar homes in the area
Home Values in the Area
Average Home Value in this Area
Purchase History
| Date | Buyer | Sale Price | Title Company |
|---|---|---|---|
| Rosario Miguel | $456,000 | -- | |
| Rosy Realty Llc | $77,000 | -- |
Source: Public Records
Mortgage History
| Date | Status | Borrower | Loan Amount |
|---|---|---|---|
| Open | Rosario Miguel | $433,200 |
Source: Public Records
Tax History
| Year | Tax Paid | Tax Assessment Tax Assessment Total Assessment is a certain percentage of the fair market value that is determined by local assessors to be the total taxable value of land and additions on the property. | Land | Improvement |
|---|---|---|---|---|
| 2025 | $7,970 | $658,100 | $140,600 | $517,500 |
| 2024 | $7,488 | $623,000 | $140,600 | $482,400 |
| 2023 | $7,898 | $608,500 | $107,100 | $501,400 |
| 2022 | $7,210 | $516,100 | $97,400 | $418,700 |
| 2021 | $6,927 | $477,700 | $81,500 | $396,200 |
| 2020 | $6,537 | $431,500 | $75,800 | $355,700 |
| 2019 | $1,068 | $68,700 | $68,700 | $0 |
| 2018 | $1,103 | $68,700 | $68,700 | $0 |
| 2017 | $1,106 | $68,700 | $68,700 | $0 |
| 2016 | $1,154 | $66,500 | $66,500 | $0 |
| 2015 | $1,207 | $66,500 | $66,500 | $0 |
| 2014 | $1,206 | $66,500 | $66,500 | $0 |
Source: Public Records
Map
Nearby Homes
Your Personal Tour Guide
Ask me questions while you tour the home.