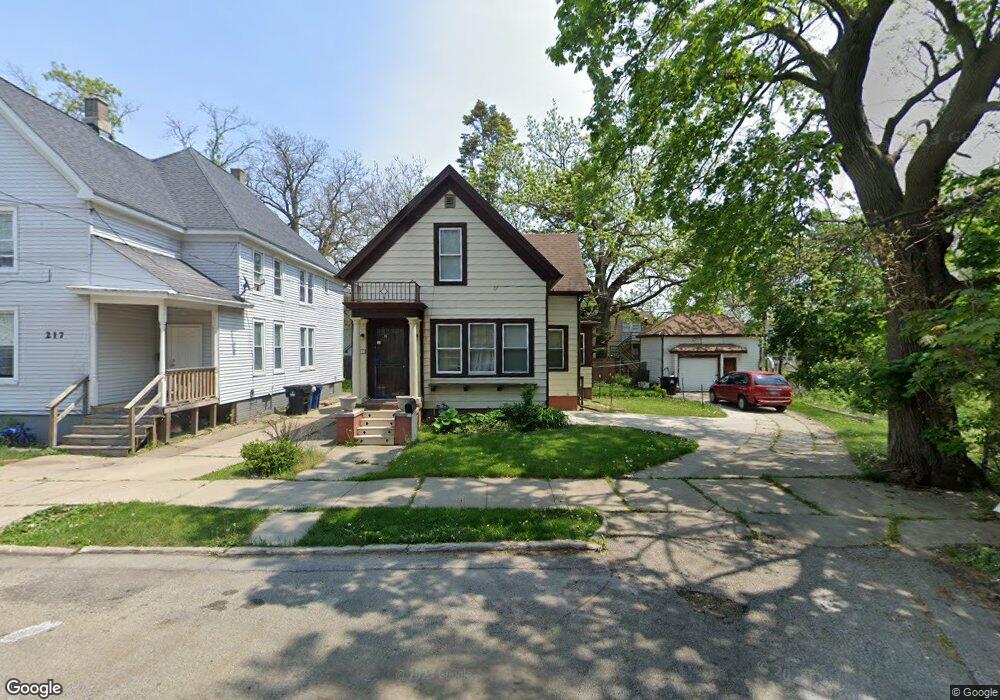
213 Frank Ave Racine, WI 53404
Riverview NeighborhoodEstimated Value: $137,000 - $148,000
3
Beds
2
Baths
1,429
Sq Ft
$100/Sq Ft
Est. Value
About This Home
This home is located at 213 Frank Ave, Racine, WI 53404 and is currently estimated at $142,993, approximately $100 per square foot. 213 Frank Ave is a home located in Racine County with nearby schools including Janes Elementary School, Park High School, and 21st Century Preparatory School.
Ownership History
Date
Name
Owned For
Owner Type
Purchase Details
Closed on
Jun 13, 2018
Sold by
Federal Home Loan Mortgage Corporation
Bought by
Mueller Richard
Current Estimated Value
Purchase Details
Closed on
Aug 21, 2015
Sold by
Ruiz Elodia S
Bought by
Ruiz Isaias
Purchase Details
Closed on
Aug 7, 2015
Sold by
Ruiz Isalas
Bought by
Federal Home Loan Mortgage Corporation
Purchase Details
Closed on
Feb 29, 2008
Sold by
Martin Joseph J
Bought by
Ruiz Isaias and Ruiz Elodia
Home Financials for this Owner
Home Financials are based on the most recent Mortgage that was taken out on this home.
Original Mortgage
$86,160
Interest Rate
5.75%
Mortgage Type
New Conventional
Purchase Details
Closed on
Jan 6, 2006
Sold by
Citifinancial Mortgage Company
Bought by
Martin Joseph
Purchase Details
Closed on
Sep 19, 2005
Sold by
Bernal Milagros
Bought by
Citifinancial Mortgage Company Ea
Create a Home Valuation Report for This Property
The Home Valuation Report is an in-depth analysis detailing your home's value as well as a comparison with similar homes in the area
Home Values in the Area
Average Home Value in this Area
Purchase History
| Date | Buyer | Sale Price | Title Company |
|---|---|---|---|
| Mueller Richard | $33,000 | Servicelink Llc | |
| Ruiz Isaias | -- | Title Service Of Southeast W | |
| Federal Home Loan Mortgage Corporation | -- | Title Services Of Southeast | |
| Ruiz Isaias | $91,400 | -- | |
| Martin Joseph | $64,900 | -- | |
| Citifinancial Mortgage Company Ea | $42,900 | -- |
Source: Public Records
Mortgage History
| Date | Status | Borrower | Loan Amount |
|---|---|---|---|
| Previous Owner | Ruiz Isaias | $86,160 |
Source: Public Records
Tax History Compared to Growth
Tax History
| Year | Tax Paid | Tax Assessment Tax Assessment Total Assessment is a certain percentage of the fair market value that is determined by local assessors to be the total taxable value of land and additions on the property. | Land | Improvement |
|---|---|---|---|---|
| 2024 | $1,696 | $76,500 | $10,600 | $65,900 |
| 2023 | $1,836 | $70,000 | $10,600 | $59,400 |
| 2022 | $1,676 | $64,000 | $10,600 | $53,400 |
| 2021 | $1,708 | $58,000 | $10,600 | $47,400 |
| 2020 | $1,671 | $58,000 | $10,600 | $47,400 |
| 2019 | $1,540 | $54,000 | $10,600 | $43,400 |
| 2018 | $1,677 | $50,000 | $10,600 | $39,400 |
| 2017 | $1,608 | $50,000 | $10,600 | $39,400 |
| 2016 | $1,639 | $50,000 | $10,600 | $39,400 |
| 2015 | $1,681 | $50,000 | $10,600 | $39,400 |
| 2014 | $1,681 | $50,000 | $10,600 | $39,400 |
| 2013 | $1,681 | $54,000 | $15,800 | $38,200 |
Source: Public Records
Map
Nearby Homes
- 423 Cliff Ave
- 1320 Maple St
- 1015 Birch St
- 1025 Birch St
- 2010 Kinzie Ave
- 943 Walnut St
- 911 Racine St
- 2105 Clarence Ave
- 1016 Davis Place
- 2339 Carmel Ave
- 1215 Racine St
- 1332 S Memorial Dr
- 945 N Memorial Dr
- 2400 Thor Ave
- 2401 Hansen Ave
- 2419 Thor Ave
- 1239 Highland Ave
- 1328 Racine St
- 1642 Washington Ave
- 1801 State St
- 217 Frank Ave
- 221 Frank Ave
- 230 Harrison St
- 226 Harrison St
- 236 Harrison St
- 218 Frank Ave
- 225 Frank Ave
- 222 Harrison St
- 240 Harrison St
- 222 Frank Ave
- 245 Frank Ave
- 246 Harrison St
- 230 Frank Ave
- 233 Frank Ave
- 210 Harrison St
- 210 Harrison St
- 233 Jones St
- 250 Harrison St
- 231 Harrison St
- 225 Harrison St