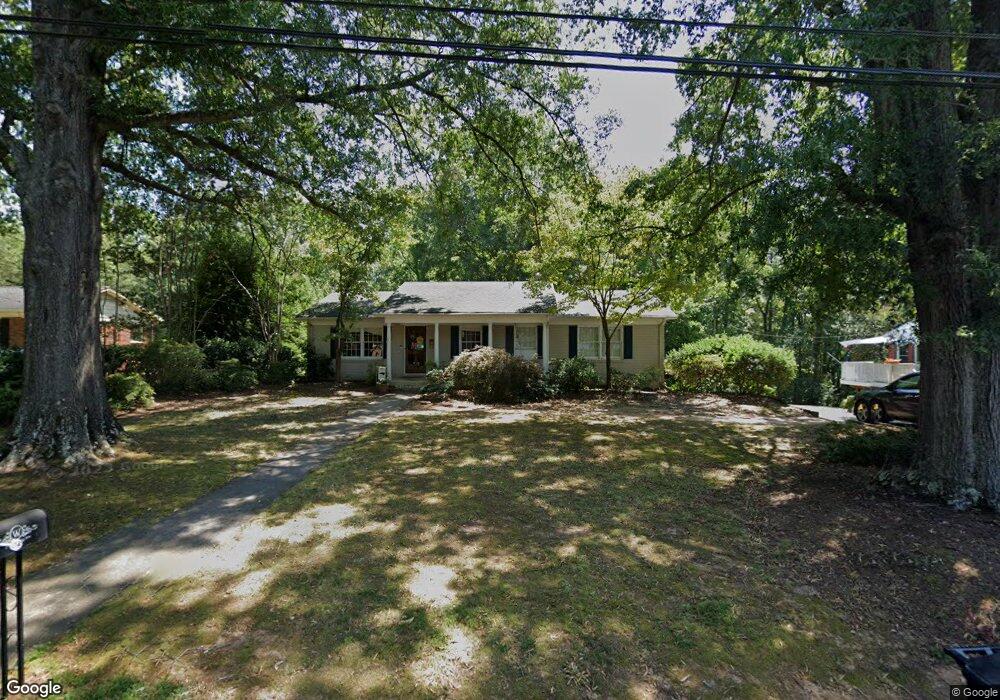
213 Fryling Ave SW Concord, NC 28025
Estimated Value: $313,000 - $370,000
3
Beds
2
Baths
1,300
Sq Ft
$254/Sq Ft
Est. Value
About This Home
This home is located at 213 Fryling Ave SW, Concord, NC 28025 and is currently estimated at $329,791, approximately $253 per square foot. 213 Fryling Ave SW is a home located in Cabarrus County with nearby schools including R Brown Mcallister STEMElementary, Concord Middle School, and Concord High School.
Ownership History
Date
Name
Owned For
Owner Type
Purchase Details
Closed on
Jun 2, 2006
Sold by
Wall James L and Wall Jill C
Bought by
Williams Joshua N and Williams Sharon A
Current Estimated Value
Home Financials for this Owner
Home Financials are based on the most recent Mortgage that was taken out on this home.
Original Mortgage
$14,500
Outstanding Balance
$8,463
Interest Rate
6.44%
Mortgage Type
Credit Line Revolving
Estimated Equity
$321,328
Purchase Details
Closed on
May 25, 2006
Sold by
Wall James Lloyd and Wall Jill C
Bought by
Williams Joshua N and Williams Sharon A
Home Financials for this Owner
Home Financials are based on the most recent Mortgage that was taken out on this home.
Original Mortgage
$14,500
Outstanding Balance
$8,463
Interest Rate
6.44%
Mortgage Type
Credit Line Revolving
Estimated Equity
$321,328
Purchase Details
Closed on
Jan 9, 2002
Sold by
Bangle Investors Inc
Bought by
Wall Ii James L and Wall Jill C
Purchase Details
Closed on
Aug 1, 1991
Bought by
Wall Ii James Lloyd
Create a Home Valuation Report for This Property
The Home Valuation Report is an in-depth analysis detailing your home's value as well as a comparison with similar homes in the area
Home Values in the Area
Average Home Value in this Area
Purchase History
| Date | Buyer | Sale Price | Title Company |
|---|---|---|---|
| Williams Joshua N | -- | None Available | |
| Williams Joshua N | $145,000 | None Available | |
| Wall Ii James L | -- | -- | |
| Wall Ii James Lloyd | $69,000 | -- |
Source: Public Records
Mortgage History
| Date | Status | Borrower | Loan Amount |
|---|---|---|---|
| Open | Williams Joshua N | $14,500 | |
| Open | Williams Joshua N | $116,000 |
Source: Public Records
Tax History Compared to Growth
Tax History
| Year | Tax Paid | Tax Assessment Tax Assessment Total Assessment is a certain percentage of the fair market value that is determined by local assessors to be the total taxable value of land and additions on the property. | Land | Improvement |
|---|---|---|---|---|
| 2025 | $3,115 | $312,720 | $96,000 | $216,720 |
| 2024 | $3,115 | $312,720 | $96,000 | $216,720 |
| 2023 | $2,166 | $177,510 | $44,400 | $133,110 |
| 2022 | $2,141 | $175,500 | $44,400 | $131,100 |
| 2021 | $2,141 | $175,500 | $44,400 | $131,100 |
| 2020 | $2,141 | $175,500 | $44,400 | $131,100 |
| 2019 | $1,763 | $144,530 | $38,400 | $106,130 |
| 2018 | $1,734 | $144,530 | $38,400 | $106,130 |
| 2017 | $1,705 | $144,530 | $38,400 | $106,130 |
| 2016 | $1,012 | $138,120 | $38,400 | $99,720 |
| 2015 | $1,630 | $138,120 | $38,400 | $99,720 |
| 2014 | $1,630 | $138,120 | $38,400 | $99,720 |
Source: Public Records
Map
Nearby Homes
- 159 Fryling Ave SW
- 671 Sedgefield St SW
- 80 Pounds Ave SW
- 736 Spring St SW
- 269 Fryling Ave SW
- 309 Brightwood Ct SW
- 782 Union St S
- 783 Union St S
- 569 Union St S
- 571 Union St S
- 111 Wilshire Ave SW
- 24 Doris Ct SE
- 34 Rollingwood Dr SE
- 23 Lawndale Ave SE
- 00 Rollingwood Ln
- 66 Arlington Ave SE
- 60 Patton Ct SE
- 745 Carolyn Dr SE
- 85 Myrtle Ave SW
- 113 Arlington Ave SE
- 205 Fryling Ave SW
- 221 Fryling Ave SW
- 214 Fryling Ave SW
- 206 Fryling Ave SW
- 197 Fryling Ave SW
- 229 Fryling Ave SW
- 198 Fryling Ave SW
- 222 Fryling Ave SW
- 191 Fryling Ave SW
- 235 Fryling Ave SW
- 190 Fryling Ave SW
- 233 Fryling Ave SW
- 213 Rutledge Ave SW
- 627 Fryling Ave SW
- 205 Rutledge Ave SW
- 197 Rutledge Ave SW
- 223 Rutledge Ave SW
- 180 Fryling Ave SW
- 243 Fryling Ave SW
- 183 Fryling Ave SW