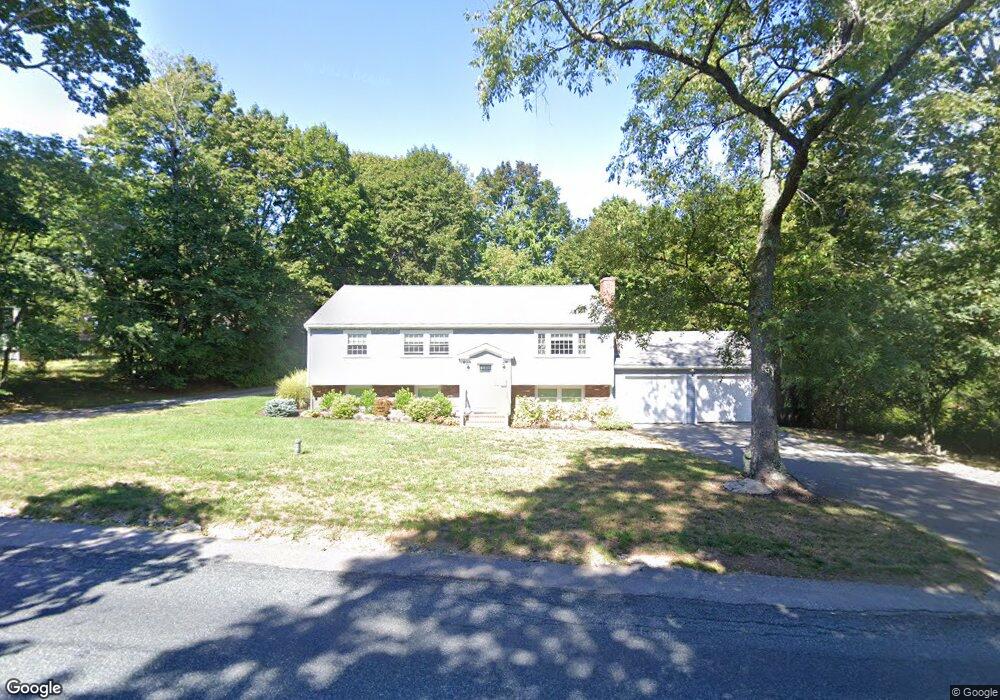
213 Gardner St Hingham, MA 02043
South Hingham NeighborhoodEstimated Value: $809,000 - $937,000
3
Beds
1
Bath
1,056
Sq Ft
$833/Sq Ft
Est. Value
About This Home
This home is located at 213 Gardner St, Hingham, MA 02043 and is currently estimated at $879,959, approximately $833 per square foot. 213 Gardner St is a home located in Plymouth County with nearby schools including South Elementary School, Hingham Middle School, and Hingham High School.
Ownership History
Date
Name
Owned For
Owner Type
Purchase Details
Closed on
May 18, 2010
Sold by
Condon Lorraine and Lyons Diane
Bought by
Gaughan Brendan and Gaughan Julianne
Current Estimated Value
Home Financials for this Owner
Home Financials are based on the most recent Mortgage that was taken out on this home.
Original Mortgage
$424,297
Outstanding Balance
$288,809
Interest Rate
5.37%
Mortgage Type
FHA
Estimated Equity
$591,150
Create a Home Valuation Report for This Property
The Home Valuation Report is an in-depth analysis detailing your home's value as well as a comparison with similar homes in the area
Home Values in the Area
Average Home Value in this Area
Purchase History
| Date | Buyer | Sale Price | Title Company |
|---|---|---|---|
| Gaughan Brendan | $320,000 | -- |
Source: Public Records
Mortgage History
| Date | Status | Borrower | Loan Amount |
|---|---|---|---|
| Open | Gaughan Brendan | $424,297 |
Source: Public Records
Tax History
| Year | Tax Paid | Tax Assessment Tax Assessment Total Assessment is a certain percentage of the fair market value that is determined by local assessors to be the total taxable value of land and additions on the property. | Land | Improvement |
|---|---|---|---|---|
| 2025 | $6,980 | $652,900 | $306,000 | $346,900 |
| 2024 | $6,711 | $618,500 | $306,000 | $312,500 |
| 2023 | $5,935 | $593,500 | $306,000 | $287,500 |
| 2022 | $6,179 | $534,500 | $264,000 | $270,500 |
| 2021 | $5,959 | $505,000 | $264,000 | $241,000 |
| 2020 | $5,770 | $500,400 | $264,000 | $236,400 |
| 2019 | $5,940 | $503,000 | $352,000 | $151,000 |
| 2018 | $5,858 | $497,700 | $352,000 | $145,700 |
| 2017 | $6,115 | $499,200 | $340,000 | $159,200 |
| 2016 | $6,245 | $500,000 | $323,900 | $176,100 |
| 2015 | $6,073 | $484,700 | $308,600 | $176,100 |
Source: Public Records
Map
Nearby Homes
- 183 Gardner St
- 18 Whiting Ln
- 100 Whiting St
- 4 Kerri Ln
- 1 Kerri Ln
- 5 Old County Rd
- 17 Pine Haven Cir
- 22 Longmeadow Rd
- 13 Independence Ln
- 18 Colby St
- 55 Turner Rd
- 1276 Washington St Unit A
- 1272 Washington St Unit G
- 2 Black Rock Dr Unit 21
- 2 Black Rock Dr
- 8 Blueberry Ct
- 16 Stacey Way
- 17 Elizabeth Ln Unit 17
- 15 Elizabeth Ln Unit 15
- 13 Elizabeth Ln Unit 13
Your Personal Tour Guide
Ask me questions while you tour the home.