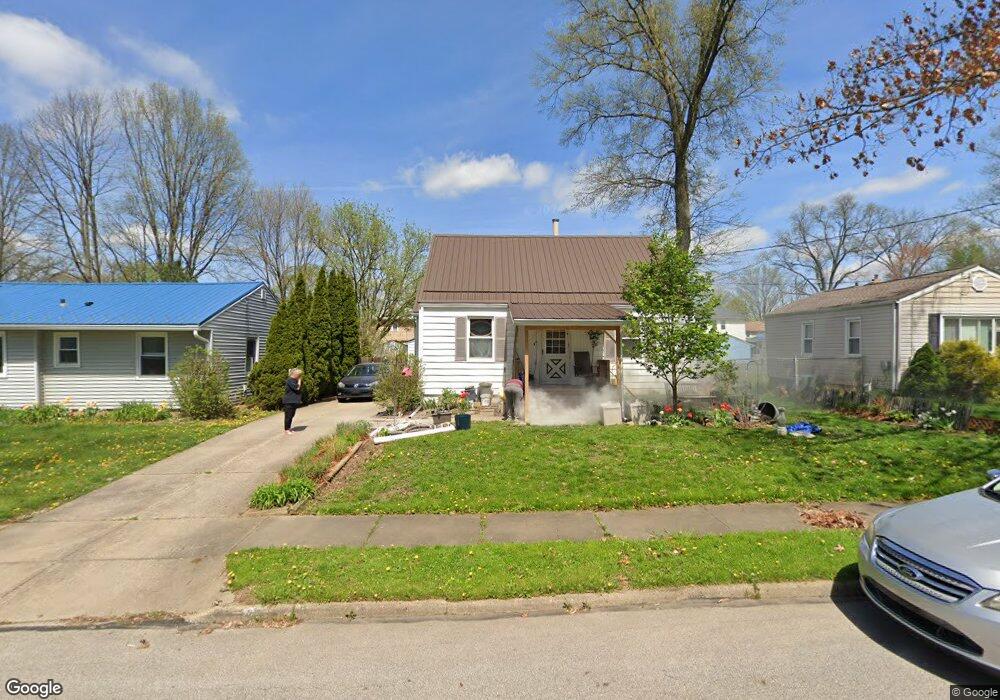
213 Grove Ave Cuyahoga Falls, OH 44221
Mud Brook NeighborhoodEstimated Value: $138,000 - $207,211
3
Beds
2
Baths
1,451
Sq Ft
$128/Sq Ft
Est. Value
About This Home
This home is located at 213 Grove Ave, Cuyahoga Falls, OH 44221 and is currently estimated at $185,553, approximately $127 per square foot. 213 Grove Ave is a home located in Summit County with nearby schools including Lincoln Elementary School, Roberts Middle School, and Cuyahoga Falls High School.
Ownership History
Date
Name
Owned For
Owner Type
Purchase Details
Closed on
Dec 27, 2016
Sold by
Donato Thomas
Bought by
Davis Crystal R
Current Estimated Value
Home Financials for this Owner
Home Financials are based on the most recent Mortgage that was taken out on this home.
Original Mortgage
$208,050
Outstanding Balance
$170,564
Interest Rate
3.94%
Mortgage Type
New Conventional
Estimated Equity
$14,989
Purchase Details
Closed on
May 27, 2008
Sold by
Lightner Larry S and Lightner Donna J
Bought by
Donato Thomas
Home Financials for this Owner
Home Financials are based on the most recent Mortgage that was taken out on this home.
Original Mortgage
$109,800
Interest Rate
5.93%
Mortgage Type
Purchase Money Mortgage
Purchase Details
Closed on
Oct 16, 2000
Sold by
Luchetti Thomas R
Bought by
Lightner Larry S and Lightner Donna J
Home Financials for this Owner
Home Financials are based on the most recent Mortgage that was taken out on this home.
Original Mortgage
$80,000
Interest Rate
7.96%
Create a Home Valuation Report for This Property
The Home Valuation Report is an in-depth analysis detailing your home's value as well as a comparison with similar homes in the area
Home Values in the Area
Average Home Value in this Area
Purchase History
| Date | Buyer | Sale Price | Title Company |
|---|---|---|---|
| Davis Crystal R | $72,000 | Miller Home Title | |
| Donato Thomas | $122,000 | Multiple | |
| Lightner Larry S | $123,000 | Minnesota Title Agency Inc |
Source: Public Records
Mortgage History
| Date | Status | Borrower | Loan Amount |
|---|---|---|---|
| Open | Davis Crystal R | $208,050 | |
| Previous Owner | Donato Thomas | $109,800 | |
| Previous Owner | Lightner Larry S | $80,000 |
Source: Public Records
Tax History Compared to Growth
Tax History
| Year | Tax Paid | Tax Assessment Tax Assessment Total Assessment is a certain percentage of the fair market value that is determined by local assessors to be the total taxable value of land and additions on the property. | Land | Improvement |
|---|---|---|---|---|
| 2025 | $2,603 | $57,390 | $10,906 | $46,484 |
| 2024 | $2,603 | $57,390 | $10,906 | $46,484 |
| 2023 | $2,603 | $57,390 | $10,906 | $46,484 |
| 2022 | $2,431 | $45,325 | $8,519 | $36,806 |
| 2021 | $3,013 | $45,325 | $8,519 | $36,806 |
| 2020 | $2,963 | $45,330 | $8,520 | $36,810 |
| 2019 | $2,651 | $36,930 | $8,520 | $28,410 |
| 2018 | $2,251 | $36,930 | $8,520 | $28,410 |
| 2017 | $2,060 | $36,930 | $8,520 | $28,410 |
| 2016 | $2,062 | $34,250 | $8,520 | $25,730 |
| 2015 | $2,060 | $34,250 | $8,520 | $25,730 |
| 2014 | $2,061 | $34,250 | $8,520 | $25,730 |
| 2013 | $2,318 | $38,850 | $8,520 | $30,330 |
Source: Public Records
Map
Nearby Homes
- 2886 Norwood St
- 2890 Bailey Rd
- 419 Keenan Ave
- 2834 Norwood St
- 455 Marguerite Ave
- 2762 Bailey Rd
- 54 Washington Ave
- 2711 Ironwood St
- 2693 Northland St
- 218 Monroe Ave
- 2736 Maplewood St
- 2762 Elmwood St
- 435 Roanoke Ave
- 229 Hayes Ave
- 2873 Oakwood Dr
- 306 Hollywood Ave
- 2855 6th St
- 418 Hayes Ave
- 324 Madison Ave
- 3320 Hudson Dr
- 209 Grove Ave
- 217 Grove Ave
- 205 Grove Ave
- 229 Grove Ave
- 236 Marguerite Ave
- 210 Grove Ave
- 224 Marguerite Ave
- 242 Marguerite Ave
- 204 Grove Ave
- 218 Marguerite Ave
- 300 Marguerite Ave
- 220 Grove Ave
- 235 Grove Ave
- 2889 Bailey Rd
- 212 Marguerite Ave
- 306 Marguerite Ave
- 2881 Bailey Rd
- 2891 Bailey Rd
- 206 Marguerite Ave
- 312 Marguerite Ave