Estimated Value: $208,000 - $239,346
3
Beds
2
Baths
1,088
Sq Ft
$203/Sq Ft
Est. Value
About This Home
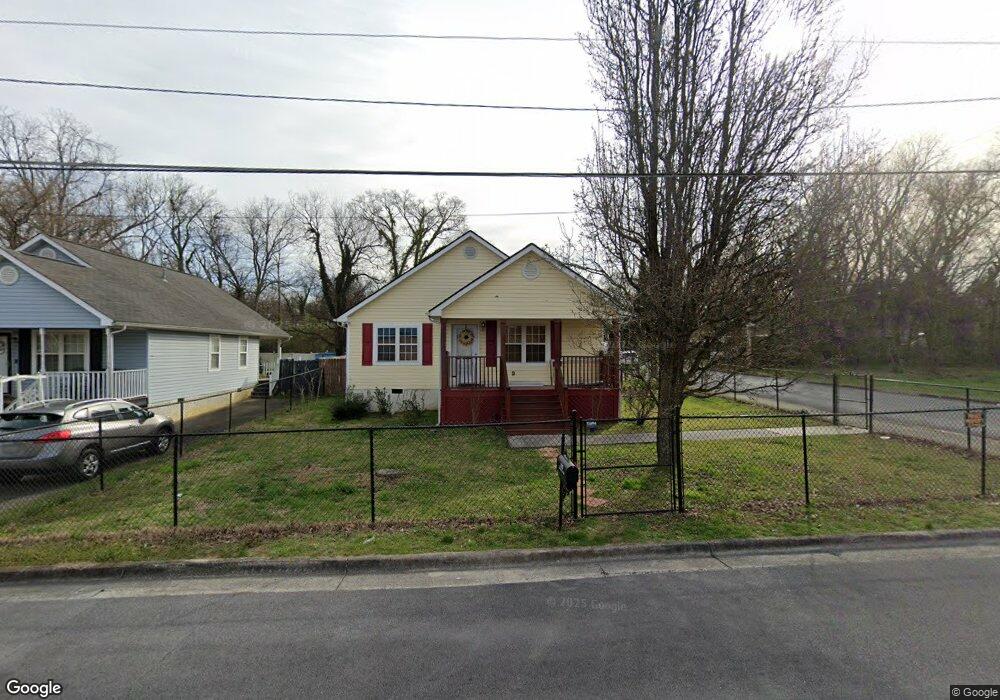
This home is located at 213 Hardy Ave SW, Rome, GA 30161 and is currently estimated at $221,337, approximately $203 per square foot. 213 Hardy Ave SW is a home located in Floyd County with nearby schools including Dan McCarty Middle School and Rome High School.
Ownership History
Date
Name
Owned For
Owner Type
Purchase Details
Closed on
Mar 17, 2023
Sold by
Guaranteed Move Llc
Bought by
Loyd Arthur S and Loyd Robyn M
Current Estimated Value
Home Financials for this Owner
Home Financials are based on the most recent Mortgage that was taken out on this home.
Original Mortgage
$194,500
Outstanding Balance
$188,599
Interest Rate
6.32%
Mortgage Type
New Conventional
Estimated Equity
$32,738
Purchase Details
Closed on
Jan 25, 2023
Sold by
Adams Shutoya P
Bought by
Guaranteed Move Llc
Home Financials for this Owner
Home Financials are based on the most recent Mortgage that was taken out on this home.
Original Mortgage
$194,500
Outstanding Balance
$188,599
Interest Rate
6.32%
Mortgage Type
New Conventional
Estimated Equity
$32,738
Purchase Details
Closed on
Nov 9, 2001
Sold by
City Of Rome
Bought by
Adams Shutoya P
Purchase Details
Closed on
Jan 28, 2000
Sold by
Braden Walter D
Bought by
City Of Rome
Purchase Details
Closed on
May 3, 1986
Sold by
Wyatt Robert G
Bought by
Braden Walter D
Purchase Details
Closed on
Jan 1, 1901
Bought by
Wyatt Robert G
Create a Home Valuation Report for This Property
The Home Valuation Report is an in-depth analysis detailing your home's value as well as a comparison with similar homes in the area
Home Values in the Area
Average Home Value in this Area
Purchase History
| Date | Buyer | Sale Price | Title Company |
|---|---|---|---|
| Loyd Arthur S | $209,500 | -- | |
| Guaranteed Move Llc | $173,000 | -- | |
| Adams Shutoya P | -- | -- | |
| City Of Rome | -- | -- | |
| Braden Walter D | -- | -- | |
| Wyatt Robert G | -- | -- |
Source: Public Records
Mortgage History
| Date | Status | Borrower | Loan Amount |
|---|---|---|---|
| Open | Loyd Arthur S | $194,500 |
Source: Public Records
Tax History Compared to Growth
Tax History
| Year | Tax Paid | Tax Assessment Tax Assessment Total Assessment is a certain percentage of the fair market value that is determined by local assessors to be the total taxable value of land and additions on the property. | Land | Improvement |
|---|---|---|---|---|
| 2024 | $2,539 | $66,146 | $5,206 | $60,940 |
| 2023 | $1,536 | $55,818 | $4,733 | $51,085 |
| 2022 | $1,300 | $39,064 | $3,786 | $35,278 |
| 2021 | $1,208 | $34,743 | $3,786 | $30,957 |
| 2020 | $1,166 | $32,479 | $2,958 | $29,521 |
| 2019 | $1,099 | $30,964 | $2,958 | $28,006 |
| 2018 | $1,041 | $29,405 | $2,958 | $26,447 |
| 2017 | $1,011 | $28,596 | $2,958 | $25,638 |
| 2016 | $996 | $28,120 | $2,920 | $25,200 |
| 2015 | $942 | $28,120 | $2,920 | $25,200 |
| 2014 | $942 | $28,120 | $2,920 | $25,200 |
Source: Public Records
Map
Nearby Homes
- 334 Branham Ave SW
- 110 Cherokee St SW
- 410 Hardy Ave SW
- 218 Wilson Ave SW
- 101 Hardy Ave SW
- 204 Myrtle St SW
- 3 Grover St SW
- 105 Mary St SW
- 107 Butler St SW
- 18 Butler St SW
- 232 S Broad St SW
- 515 Harper Ave SW
- 3 Porter St SW
- 529 Branham Ave SW
- 515 S Broad St SW
- 115 Lookout Cir SW
- 113 Lookout Cir SW
- 111 Lookout Cir SW
- 5 Jervis St SW
- 211 Hardy Ave SW
- 209 Hardy Ave SW
- 307 Cherokee St SW
- 304 Cherokee St SW
- 207 Hardy Ave SW
- 332 Branham Ave SW
- 400 Branham Ave SW
- 330 Branham Ave SW
- 205 Hardy Ave SW
- 328 Branham Ave SW
- 402 Branham Ave SW
- 203 Hardy Ave SW
- 326 Branham Ave SW
- 406 Branham Ave SW
- 307 Hardy Ave SW
- 324 Branham Ave SW
- 201 Hardy Ave SW
- 408 Branham Ave SW
- 333 Branham Ave SW
- 309 Hardy Ave SW