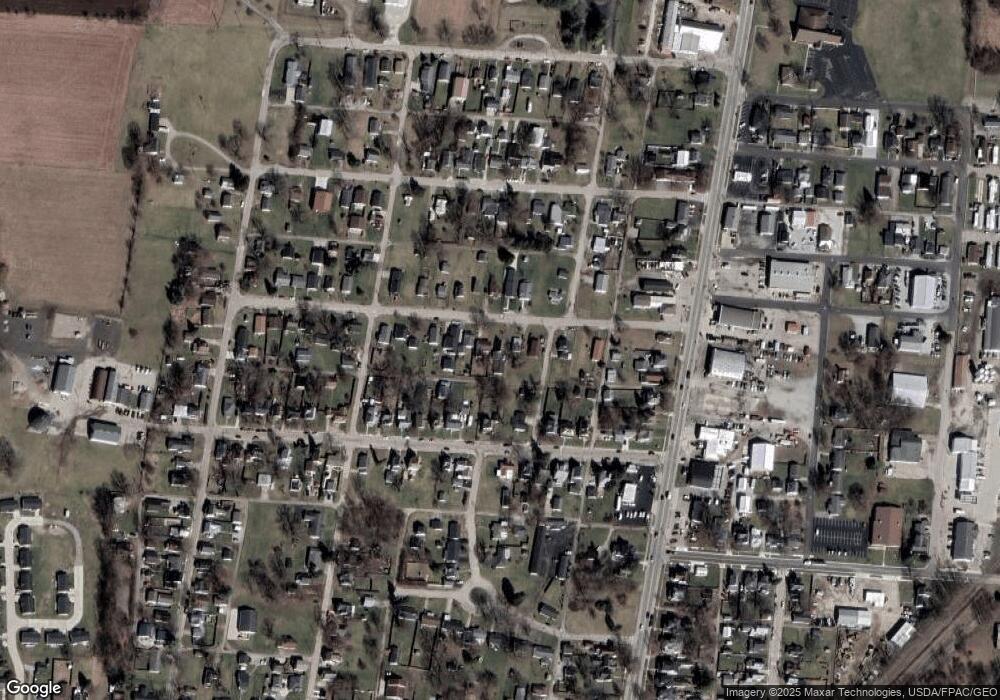
213 Harmon Ave Urbana, OH 43078
Estimated Value: $163,000 - $220,000
3
Beds
1
Bath
1,134
Sq Ft
$169/Sq Ft
Est. Value
About This Home
This home is located at 213 Harmon Ave, Urbana, OH 43078 and is currently estimated at $191,275, approximately $168 per square foot. 213 Harmon Ave is a home located in Champaign County with nearby schools including Urbana Elementary School, Urbana High School, and Urbana Community School.
Ownership History
Date
Name
Owned For
Owner Type
Purchase Details
Closed on
Nov 23, 2015
Sold by
Horsley Lynn A and Lawson Lynn A
Bought by
Horsley David L
Current Estimated Value
Purchase Details
Closed on
Jul 10, 2008
Sold by
Secretary Of Veterans Affairs
Bought by
Horsley David L and Horsley Lynn A
Purchase Details
Closed on
Apr 17, 2008
Sold by
Venerick Kenneth C
Bought by
Secretary Of Veterans Affairs
Purchase Details
Closed on
Apr 7, 2008
Sold by
Venrick Kenneth C
Bought by
Secretary Of Veterans Affairs
Purchase Details
Closed on
Apr 8, 2003
Sold by
Smith Phillip M
Bought by
Venrick Kenneth C
Home Financials for this Owner
Home Financials are based on the most recent Mortgage that was taken out on this home.
Original Mortgage
$79,050
Interest Rate
5.71%
Mortgage Type
VA
Create a Home Valuation Report for This Property
The Home Valuation Report is an in-depth analysis detailing your home's value as well as a comparison with similar homes in the area
Home Values in the Area
Average Home Value in this Area
Purchase History
| Date | Buyer | Sale Price | Title Company |
|---|---|---|---|
| Horsley David L | -- | None Available | |
| Horsley David L | $17,750 | None Available | |
| Secretary Of Veterans Affairs | $49,303 | None Available | |
| Secretary Of Veterans Affairs | $49,303 | None Available | |
| Venrick Kenneth C | -- | -- |
Source: Public Records
Mortgage History
| Date | Status | Borrower | Loan Amount |
|---|---|---|---|
| Previous Owner | Venrick Kenneth C | $79,050 |
Source: Public Records
Tax History Compared to Growth
Tax History
| Year | Tax Paid | Tax Assessment Tax Assessment Total Assessment is a certain percentage of the fair market value that is determined by local assessors to be the total taxable value of land and additions on the property. | Land | Improvement |
|---|---|---|---|---|
| 2024 | $1,530 | $37,190 | $4,450 | $32,740 |
| 2023 | $1,530 | $37,190 | $4,450 | $32,740 |
| 2022 | $1,561 | $37,190 | $4,450 | $32,740 |
| 2021 | $1,409 | $29,750 | $3,560 | $26,190 |
| 2020 | $1,408 | $29,750 | $3,560 | $26,190 |
| 2019 | $1,391 | $29,750 | $3,560 | $26,190 |
| 2018 | $1,156 | $23,630 | $3,420 | $20,210 |
| 2017 | $1,148 | $23,630 | $3,420 | $20,210 |
| 2016 | $1,150 | $23,630 | $3,420 | $20,210 |
| 2015 | $1,230 | $22,810 | $3,420 | $19,390 |
| 2014 | $1,232 | $22,810 | $3,420 | $19,390 |
| 2013 | $1,082 | $24,620 | $3,420 | $21,200 |
Source: Public Records
Map
Nearby Homes