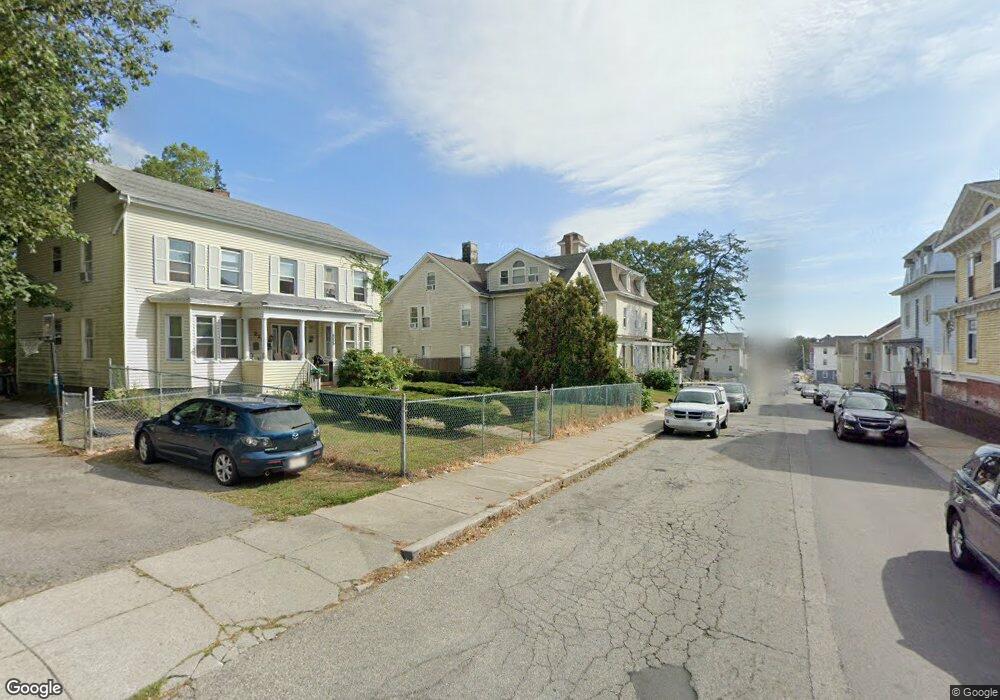
213 High St Fall River, MA 02720
Bank Street NeighborhoodEstimated Value: $409,633 - $686,000
6
Beds
3
Baths
3,314
Sq Ft
$163/Sq Ft
Est. Value
About This Home
This home is located at 213 High St, Fall River, MA 02720 and is currently estimated at $539,658, approximately $162 per square foot. 213 High St is a home located in Bristol County with nearby schools including Mary Fonseca Elementary School, Morton Middle School, and B M C Durfee High School.
Ownership History
Date
Name
Owned For
Owner Type
Purchase Details
Closed on
Jul 12, 1991
Sold by
Flanagan Joseph P
Bought by
Machado Carlos R and Machado Adelia S
Current Estimated Value
Home Financials for this Owner
Home Financials are based on the most recent Mortgage that was taken out on this home.
Original Mortgage
$60,900
Interest Rate
9.35%
Mortgage Type
Purchase Money Mortgage
Create a Home Valuation Report for This Property
The Home Valuation Report is an in-depth analysis detailing your home's value as well as a comparison with similar homes in the area
Home Values in the Area
Average Home Value in this Area
Purchase History
| Date | Buyer | Sale Price | Title Company |
|---|---|---|---|
| Machado Carlos R | $87,000 | -- |
Source: Public Records
Mortgage History
| Date | Status | Borrower | Loan Amount |
|---|---|---|---|
| Closed | Machado Carlos R | $60,900 | |
| Previous Owner | Machado Carlos R | $55,000 | |
| Previous Owner | Machado Carlos R | $90,000 |
Source: Public Records
Tax History
| Year | Tax Paid | Tax Assessment Tax Assessment Total Assessment is a certain percentage of the fair market value that is determined by local assessors to be the total taxable value of land and additions on the property. | Land | Improvement |
|---|---|---|---|---|
| 2025 | $5,715 | $499,100 | $114,400 | $384,700 |
| 2024 | $5,493 | $478,100 | $112,200 | $365,900 |
| 2023 | $4,925 | $401,400 | $101,000 | $300,400 |
| 2022 | $4,153 | $329,100 | $95,300 | $233,800 |
| 2021 | $3,832 | $277,100 | $91,100 | $186,000 |
| 2020 | $3,451 | $238,800 | $86,900 | $151,900 |
| 2019 | $3,090 | $211,900 | $90,800 | $121,100 |
| 2018 | $2,928 | $200,300 | $91,500 | $108,800 |
| 2017 | $2,804 | $200,300 | $91,500 | $108,800 |
| 2016 | $2,731 | $200,400 | $94,300 | $106,100 |
| 2015 | $2,621 | $200,400 | $94,300 | $106,100 |
| 2014 | $2,647 | $210,400 | $94,300 | $116,100 |
Source: Public Records
Map
Nearby Homes
- 501 Pine St
- 528 Cherry St Unit 3
- 233 Franklin St
- 229 Franklin St
- 104 Oak St
- 89 Oak St
- 150 Purchase St
- 360 High St
- 275 Bank St
- 464 Bank St Unit 10
- 126 June St
- 499 Maple St
- 631 Walnut St
- 511 Bank St
- 450 Rock St Unit 1
- 610 Walnut St
- 206 Durfee St Unit 1A
- 206 Durfee St Unit 2B
- 206 Durfee St Unit 2A
- 206 Durfee St Unit 1B
Your Personal Tour Guide
Ask me questions while you tour the home.