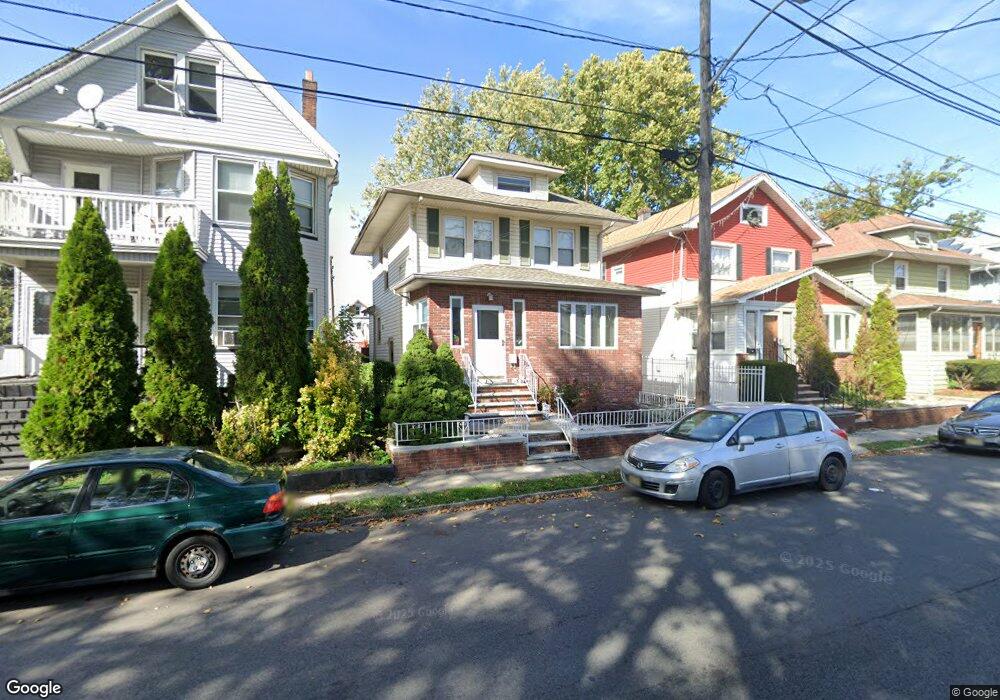
213 Hollywood Ave Hillside, NJ 07205
Westminster NeighborhoodEstimated Value: $412,553 - $580,000
--
Bed
--
Bath
1,188
Sq Ft
$416/Sq Ft
Est. Value
About This Home
This home is located at 213 Hollywood Ave, Hillside, NJ 07205 and is currently estimated at $493,638, approximately $415 per square foot. 213 Hollywood Ave is a home located in Union County with nearby schools including Abram P. Morris-Saybrook Elementary School, Hurden Looker School, and Ola Edwards Community School.
Ownership History
Date
Name
Owned For
Owner Type
Purchase Details
Closed on
Sep 28, 2001
Sold by
Lopez Jose E and Lopez Luz A
Bought by
Lopez Jose O and Lopez Luz A
Current Estimated Value
Purchase Details
Closed on
Nov 15, 2000
Sold by
Fischetti Robert and Fischetti Dawn
Bought by
Lopez Jose E and Lopez Luz A
Home Financials for this Owner
Home Financials are based on the most recent Mortgage that was taken out on this home.
Original Mortgage
$144,600
Interest Rate
7.64%
Mortgage Type
Stand Alone First
Purchase Details
Closed on
Jan 12, 2000
Sold by
Fischetti Dawn and Decamp Dawn
Bought by
Fischetti Robert and Fischetti Dawn
Purchase Details
Closed on
Oct 30, 1996
Sold by
Perez Jose L and Perez Juana C
Bought by
Decamp Dawn
Home Financials for this Owner
Home Financials are based on the most recent Mortgage that was taken out on this home.
Original Mortgage
$84,000
Interest Rate
7.99%
Create a Home Valuation Report for This Property
The Home Valuation Report is an in-depth analysis detailing your home's value as well as a comparison with similar homes in the area
Home Values in the Area
Average Home Value in this Area
Purchase History
| Date | Buyer | Sale Price | Title Company |
|---|---|---|---|
| Lopez Jose O | -- | -- | |
| Lopez Jose E | $160,000 | -- | |
| Fischetti Robert | -- | -- | |
| Decamp Dawn | $120,000 | -- |
Source: Public Records
Mortgage History
| Date | Status | Borrower | Loan Amount |
|---|---|---|---|
| Previous Owner | Lopez Jose E | $144,600 | |
| Previous Owner | Decamp Dawn | $84,000 |
Source: Public Records
Tax History Compared to Growth
Tax History
| Year | Tax Paid | Tax Assessment Tax Assessment Total Assessment is a certain percentage of the fair market value that is determined by local assessors to be the total taxable value of land and additions on the property. | Land | Improvement |
|---|---|---|---|---|
| 2025 | $9,507 | $115,200 | $52,500 | $62,700 |
| 2024 | $9,231 | $115,200 | $52,500 | $62,700 |
| 2023 | $9,231 | $115,200 | $52,500 | $62,700 |
| 2022 | $9,146 | $115,200 | $52,500 | $62,700 |
| 2021 | $9,086 | $115,200 | $52,500 | $62,700 |
| 2020 | $9,033 | $115,200 | $52,500 | $62,700 |
| 2019 | $8,858 | $115,200 | $52,500 | $62,700 |
| 2018 | $8,769 | $115,200 | $52,500 | $62,700 |
| 2017 | $8,716 | $115,200 | $52,500 | $62,700 |
| 2016 | $8,706 | $115,200 | $52,500 | $62,700 |
| 2015 | $8,628 | $115,200 | $52,500 | $62,700 |
| 2014 | $8,493 | $115,200 | $52,500 | $62,700 |
Source: Public Records
Map
Nearby Homes
- 1141 Church St
- 1290 Baker St
- 1282 Baker St
- 155 Silver Ave
- 376 Hollywood Ave
- 124 Woodruff Place
- 149 Baltimore Ave
- 1406 Maple Ave
- 1451 Bond St
- 1444 N Broad St
- 420 Hollywood Ave
- 1414 Boa Place Unit 2
- 1473 Center St
- 383 Conant St
- 220 Silver Ave
- 628 Us Highway 22 and 3
- 170 Windsor Way
- 1408 Lexington Place Unit 1410
- 257 Herbert Ave
- 1379 Garfield Place
- 211 Hollywood Ave
- 215 Hollywood Ave
- 217 Hollywood Ave
- 209 Hollywood Ave
- 207 Hollywood Ave
- 219 Hollywood Ave
- 212 Hollywood Ave
- 205 Hollywood Ave
- 221 Hollywood Ave
- 214 Hollywood Ave
- 1268 Miriam Place
- 203 Hollywood Ave
- 223 Hollywood Ave
- 200 Pennsylvania Ave
- 1272 Miriam Place
- 163 Frances Place
- 1264 Miriam Place
- 218 Hollywood Ave
- 144 Pennsylvania Ave
- 146 Pennsylvania Ave