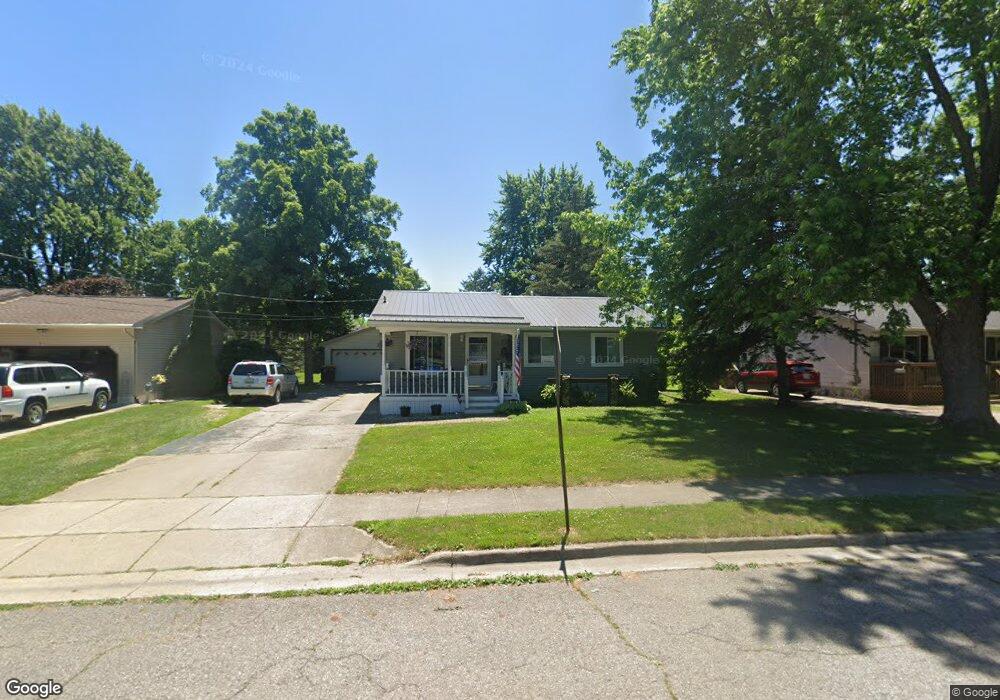
213 Hurd St Saint Johns, MI 48879
Estimated Value: $185,000 - $220,288
3
Beds
1
Bath
1,008
Sq Ft
$196/Sq Ft
Est. Value
About This Home
This home is located at 213 Hurd St, Saint Johns, MI 48879 and is currently estimated at $197,572, approximately $196 per square foot. 213 Hurd St is a home located in Clinton County with nearby schools including St. Johns High School and St Joseph Catholic School.
Ownership History
Date
Name
Owned For
Owner Type
Purchase Details
Closed on
Dec 2, 2016
Sold by
Ludwick J Michael C
Bought by
Ludwick Michael C and Ludwick Michelle M
Current Estimated Value
Purchase Details
Closed on
Jul 24, 2014
Sold by
Schroeder Frederick C and Schroeder Lisa
Bought by
Ernst Patricia L and Ernst Zachary
Home Financials for this Owner
Home Financials are based on the most recent Mortgage that was taken out on this home.
Original Mortgage
$84,000
Interest Rate
4.19%
Mortgage Type
New Conventional
Purchase Details
Closed on
Dec 28, 2009
Sold by
Ernst Patricia L and Droste Patricia
Bought by
Schroeder Frederick C
Create a Home Valuation Report for This Property
The Home Valuation Report is an in-depth analysis detailing your home's value as well as a comparison with similar homes in the area
Home Values in the Area
Average Home Value in this Area
Purchase History
| Date | Buyer | Sale Price | Title Company |
|---|---|---|---|
| Ludwick Michael C | $116 | -- | |
| Ernst Patricia L | $85,000 | Midstate Title Agency Llc | |
| Schroeder Frederick C | $70,000 | None Available |
Source: Public Records
Mortgage History
| Date | Status | Borrower | Loan Amount |
|---|---|---|---|
| Previous Owner | Ernst Patricia L | $84,000 |
Source: Public Records
Tax History Compared to Growth
Tax History
| Year | Tax Paid | Tax Assessment Tax Assessment Total Assessment is a certain percentage of the fair market value that is determined by local assessors to be the total taxable value of land and additions on the property. | Land | Improvement |
|---|---|---|---|---|
| 2025 | $2,362 | $80,500 | $17,300 | $63,200 |
| 2024 | $1,645 | $77,200 | $17,300 | $59,900 |
| 2023 | $1,550 | $71,000 | $0 | $0 |
| 2022 | $2,129 | $64,500 | $15,200 | $49,300 |
| 2021 | $2,075 | $60,300 | $13,000 | $47,300 |
| 2020 | $2,003 | $56,200 | $11,900 | $44,300 |
| 2019 | $1,945 | $54,700 | $11,900 | $42,800 |
| 2018 | $1,807 | $51,800 | $11,900 | $39,900 |
| 2017 | -- | $52,000 | $11,900 | $40,100 |
| 2016 | -- | $47,400 | $11,300 | $36,100 |
| 2015 | -- | $45,500 | $0 | $0 |
| 2011 | -- | $42,500 | $0 | $0 |
Source: Public Records
Map
Nearby Homes
- 106 W Oak St
- 1105 S Wight St
- 511 S Church St
- 1519 S Lansing St
- 501 S Clinton Ave
- 306 S Emmons St
- 812 W Park St
- 502 E Mcconnell St
- 1455 W Hyde Rd
- 1275 Fieldstone Dr
- 111 N Ottawa St
- 1107 Sunview Dr
- 812 W Cass St
- 800 W State St
- 301 E Walker St
- 700 E Townsend Rd
- 204 N Whittemore St
- 306 S Swegles St
- 504 Vauconsant St
- 903 E State St