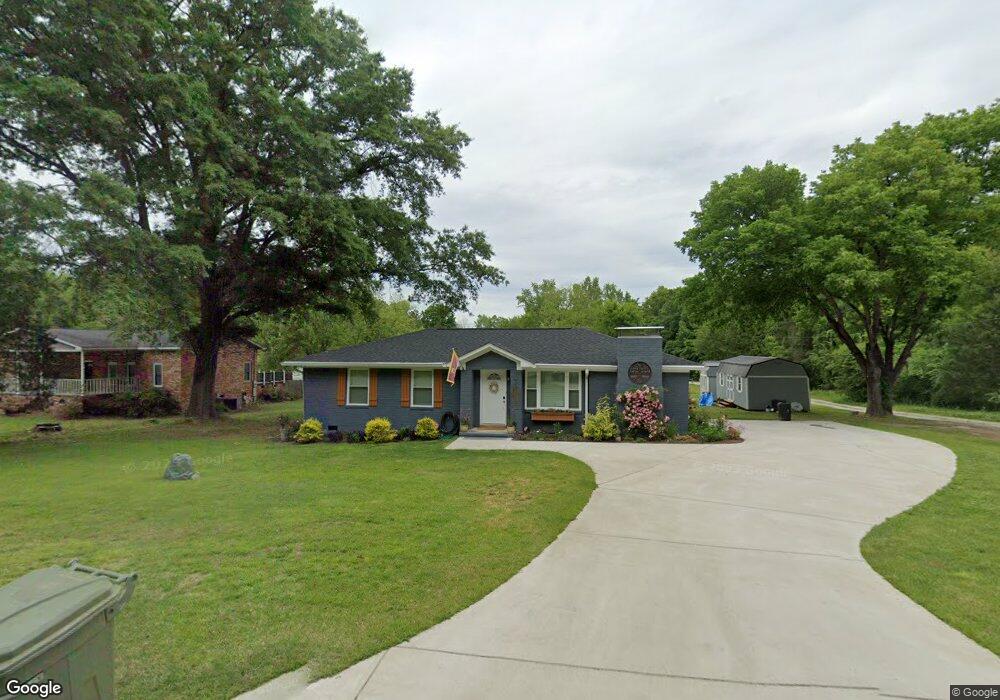
213 Joe Free Rd Chapin, SC 29036
Estimated Value: $248,000 - $387,000
3
Beds
2
Baths
1,274
Sq Ft
$246/Sq Ft
Est. Value
About This Home
This home is located at 213 Joe Free Rd, Chapin, SC 29036 and is currently estimated at $313,831, approximately $246 per square foot. 213 Joe Free Rd is a home located in Richland County with nearby schools including Lake Murray Elementary School, Chapin Intermediate, and Chapin High School.
Ownership History
Date
Name
Owned For
Owner Type
Purchase Details
Closed on
Jul 22, 2021
Sold by
Mosteller E Randy E and Mosteller Elbert Randall
Bought by
Macaluso Terry and Macaluso Brenda
Current Estimated Value
Home Financials for this Owner
Home Financials are based on the most recent Mortgage that was taken out on this home.
Original Mortgage
$170,400
Outstanding Balance
$154,753
Interest Rate
2.96%
Mortgage Type
New Conventional
Estimated Equity
$159,078
Purchase Details
Closed on
Feb 16, 2021
Sold by
Mitchell Frank B
Bought by
Buchholz John H and Buchholz Terri R
Purchase Details
Closed on
Oct 22, 2013
Sold by
Free Sharon and Wise Leon
Bought by
Mosteller E Randy
Purchase Details
Closed on
Jan 19, 2009
Sold by
Free Danny
Bought by
Free Sharon and Wise Leon
Purchase Details
Closed on
Oct 3, 2008
Sold by
Free Danny
Bought by
Free Sharon and Wise Leon
Create a Home Valuation Report for This Property
The Home Valuation Report is an in-depth analysis detailing your home's value as well as a comparison with similar homes in the area
Home Values in the Area
Average Home Value in this Area
Purchase History
| Date | Buyer | Sale Price | Title Company |
|---|---|---|---|
| Macaluso Terry | $219,900 | Harvey & Vallini Llc | |
| Buchholz John H | $162,000 | None Listed On Document | |
| Mosteller E Randy | $19,000 | None Available | |
| Free Sharon | -- | -- | |
| Free Sharon | -- | -- |
Source: Public Records
Mortgage History
| Date | Status | Borrower | Loan Amount |
|---|---|---|---|
| Open | Macaluso Terry | $170,400 |
Source: Public Records
Tax History Compared to Growth
Tax History
| Year | Tax Paid | Tax Assessment Tax Assessment Total Assessment is a certain percentage of the fair market value that is determined by local assessors to be the total taxable value of land and additions on the property. | Land | Improvement |
|---|---|---|---|---|
| 2024 | $7,692 | $268,000 | $0 | $0 |
| 2023 | $7,645 | $8,796 | $0 | $0 |
| 2022 | $6,033 | $219,900 | $173,000 | $46,900 |
| 2021 | $2,806 | $5,720 | $0 | $0 |
| 2020 | $2,855 | $5,720 | $0 | $0 |
| 2019 | $2,893 | $5,720 | $0 | $0 |
| 2018 | $2,412 | $4,970 | $0 | $0 |
| 2017 | $2,388 | $4,970 | $0 | $0 |
| 2016 | $1,937 | $4,970 | $0 | $0 |
| 2015 | $1,892 | $4,840 | $0 | $0 |
| 2014 | $2,223 | $80,600 | $0 | $0 |
| 2013 | -- | $3,220 | $0 | $0 |
Source: Public Records
Map
Nearby Homes
- 50 Steve Free Rd
- 454 Hollow Cove Rd
- 320 Hollow Cove Rd
- 668 Autumn Ridge Rd
- 549 Everton Dr
- 297 Massey Cir
- 319 Sienna Dr
- 445 Crawley Ln
- 947 Stradley Ln
- 512 Eagles Rest Dr
- 420 Crawley Ln
- 7 Sienna Ct
- 869 Sunseeker Dr
- 515 Eagles Rest Dr
- 13 Morning Breeze Ct
- 873 Sunseeker Dr
- 649 Clover View Rd
- 613 Sea Doo Dr
- 636 Clover View Rd
- 816 Burnview Ln
- 219 Joe Free Rd
- 211 Joe Free Rd
- 209 Joe Free Rd
- 221 Joe Free Rd
- 63 Steve Free Rd
- 218 Joe Free Rd
- 222 Joe Free Rd
- 212 Joe Free Rd
- 200 Joe Free Rd
- 124 Bakersland Rd
- 126 Bakersland Rd
- 223 Joe Free Rd
- 130 Bakersland Rd
- 108 Joe Free Rd
- 238 Joe Free Rd
- 240 Joe Free Rd
- 0 Bakersland Rd
- 125 Bakersland Rd
- 36 Steve Free Rd
- 125 Joe Free Rd