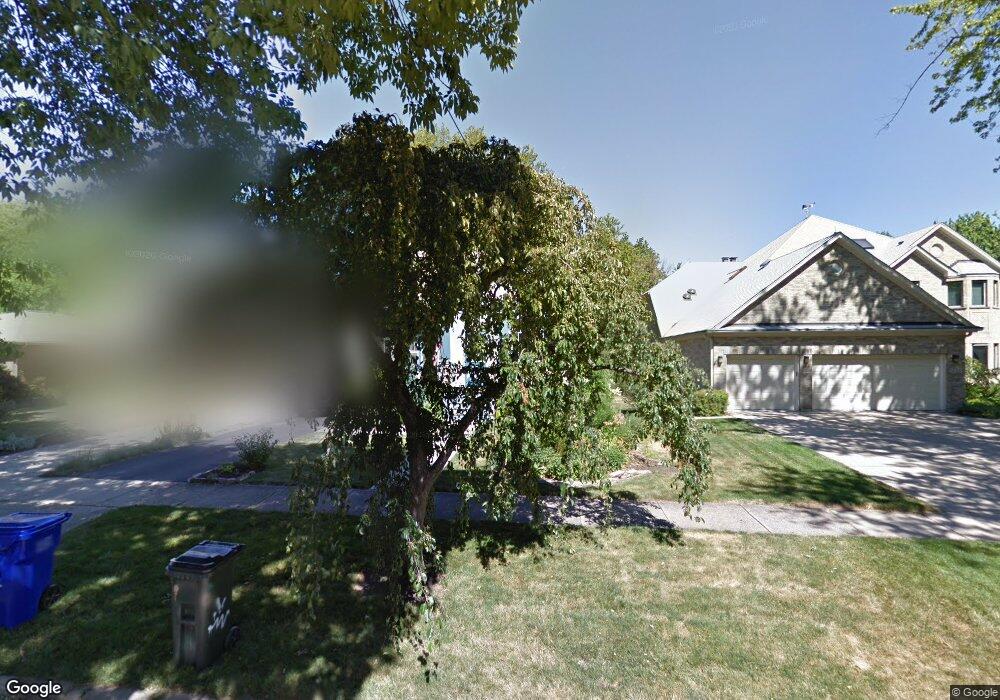
213 Kenilworth Ave Glen Ellyn, IL 60137
Estimated Value: $520,989 - $617,000
3
Beds
2
Baths
1,377
Sq Ft
$411/Sq Ft
Est. Value
About This Home
This home is located at 213 Kenilworth Ave, Glen Ellyn, IL 60137 and is currently estimated at $566,497, approximately $411 per square foot. 213 Kenilworth Ave is a home located in DuPage County with nearby schools including Abraham Lincoln Elementary School, Hadley Junior High School, and Glenbard West High School.
Ownership History
Date
Name
Owned For
Owner Type
Purchase Details
Closed on
Nov 4, 2016
Sold by
Goretta David L and Anderson Carol
Bought by
Page Michael J and Page Elaine F
Current Estimated Value
Home Financials for this Owner
Home Financials are based on the most recent Mortgage that was taken out on this home.
Original Mortgage
$244,800
Outstanding Balance
$196,532
Interest Rate
3.42%
Mortgage Type
New Conventional
Estimated Equity
$369,965
Create a Home Valuation Report for This Property
The Home Valuation Report is an in-depth analysis detailing your home's value as well as a comparison with similar homes in the area
Home Values in the Area
Average Home Value in this Area
Purchase History
| Date | Buyer | Sale Price | Title Company |
|---|---|---|---|
| Page Michael J | $272,000 | Attorneys Title Guaranty Fun |
Source: Public Records
Mortgage History
| Date | Status | Borrower | Loan Amount |
|---|---|---|---|
| Open | Page Michael J | $244,800 |
Source: Public Records
Tax History Compared to Growth
Tax History
| Year | Tax Paid | Tax Assessment Tax Assessment Total Assessment is a certain percentage of the fair market value that is determined by local assessors to be the total taxable value of land and additions on the property. | Land | Improvement |
|---|---|---|---|---|
| 2024 | $9,943 | $148,369 | $49,344 | $99,025 |
| 2023 | $9,490 | $136,570 | $45,420 | $91,150 |
| 2022 | $7,338 | $105,100 | $42,930 | $62,170 |
| 2021 | $7,055 | $101,560 | $41,910 | $59,650 |
| 2020 | $6,914 | $100,610 | $41,520 | $59,090 |
| 2019 | $6,755 | $97,950 | $40,420 | $57,530 |
| 2018 | $7,586 | $108,450 | $40,260 | $68,190 |
| 2017 | $7,468 | $104,440 | $38,770 | $65,670 |
| 2016 | $7,562 | $100,270 | $37,220 | $63,050 |
| 2015 | $7,537 | $95,660 | $35,510 | $60,150 |
| 2014 | $6,779 | $83,720 | $20,470 | $63,250 |
| 2013 | $6,600 | $83,970 | $20,530 | $63,440 |
Source: Public Records
Map
Nearby Homes
- 111 N Kenilworth Ave
- 331 Lorraine St
- 418 Hill Ave
- 566 Glendale Ave
- 1411 College Ave
- 216 N Blanchard St
- 404 Melrose Ave Unit 204
- 615 N Blanchard St
- 360 N Main St
- 53 N Main St
- 562 Summerdale Ave
- 451 Duane St
- 1409 E Harrison Ave
- 505 Kenilworth Ave Unit 4
- 1106 E North Path
- 504 Newton Ave
- 303 S President St
- 1000 S Lorraine Rd Unit 412
- 606 Lakeview Terrace
- 1010 E Illinois St
- 211 Kenilworth Ave
- 207 Kenilworth Ave
- 221 Kenilworth Ave
- 225 Kenilworth Ave
- 201 Kenilworth Ave
- 308 Greenfield Ave
- 216 Kenilworth Ave
- 229 N Kenilworth Ave
- 220 Kenilworth Ave
- 212 Kenilworth Ave
- 206 Kenilworth Ave
- 314 Greenfield Ave
- 235 Kenilworth Ave
- 222 Kenilworth Ave
- 228 Kenilworth Ave
- 324 Greenfield Ave
- 315 Greenfield Ave
- 303 Greenfield Ave
- 234 N Kenilworth Ave
- 239 Kenilworth Ave