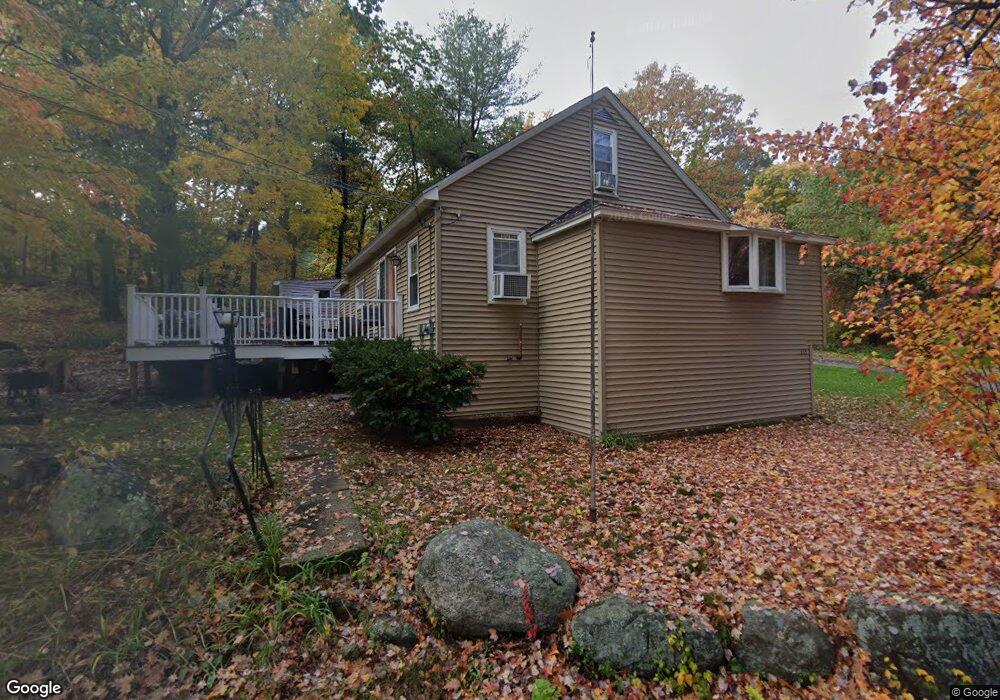
213 Lowe St Leominster, MA 01453
Estimated Value: $303,000 - $424,000
3
Beds
1
Bath
974
Sq Ft
$388/Sq Ft
Est. Value
About This Home
This home is located at 213 Lowe St, Leominster, MA 01453 and is currently estimated at $377,639, approximately $387 per square foot. 213 Lowe St is a home located in Worcester County with nearby schools including Leominster High School, St. Leo School, and St. Anna Catholic School.
Ownership History
Date
Name
Owned For
Owner Type
Purchase Details
Closed on
Nov 12, 2021
Sold by
Schofield Mark
Bought by
Schofield Matthew J
Current Estimated Value
Home Financials for this Owner
Home Financials are based on the most recent Mortgage that was taken out on this home.
Original Mortgage
$165,000
Outstanding Balance
$151,236
Interest Rate
3.01%
Mortgage Type
Purchase Money Mortgage
Estimated Equity
$226,403
Purchase Details
Closed on
Nov 22, 2016
Sold by
Mahoney Karen E
Bought by
Schofield Mark
Purchase Details
Closed on
Apr 21, 1988
Sold by
Gelinas Gary E
Bought by
Mahoney Karen E
Home Financials for this Owner
Home Financials are based on the most recent Mortgage that was taken out on this home.
Original Mortgage
$80,750
Interest Rate
9.89%
Mortgage Type
Purchase Money Mortgage
Create a Home Valuation Report for This Property
The Home Valuation Report is an in-depth analysis detailing your home's value as well as a comparison with similar homes in the area
Home Values in the Area
Average Home Value in this Area
Purchase History
| Date | Buyer | Sale Price | Title Company |
|---|---|---|---|
| Schofield Matthew J | $220,000 | None Available | |
| Schofield Mark | $125,000 | -- | |
| Mahoney Karen E | $85,000 | -- |
Source: Public Records
Mortgage History
| Date | Status | Borrower | Loan Amount |
|---|---|---|---|
| Open | Schofield Matthew J | $165,000 | |
| Previous Owner | Mahoney Karen E | $11,000 | |
| Previous Owner | Mahoney Karen E | $80,750 |
Source: Public Records
Tax History Compared to Growth
Tax History
| Year | Tax Paid | Tax Assessment Tax Assessment Total Assessment is a certain percentage of the fair market value that is determined by local assessors to be the total taxable value of land and additions on the property. | Land | Improvement |
|---|---|---|---|---|
| 2025 | $5,052 | $360,100 | $156,400 | $203,700 |
| 2024 | $4,907 | $338,200 | $148,900 | $189,300 |
| 2023 | $4,699 | $302,400 | $129,600 | $172,800 |
| 2022 | $4,476 | $270,300 | $112,700 | $157,600 |
| 2021 | $4,164 | $229,700 | $87,900 | $141,800 |
| 2020 | $3,983 | $221,500 | $87,900 | $133,600 |
| 2019 | $3,825 | $206,300 | $83,700 | $122,600 |
| 2018 | $3,491 | $180,600 | $81,200 | $99,400 |
| 2017 | $3,384 | $171,500 | $75,800 | $95,700 |
| 2016 | $3,192 | $163,000 | $75,800 | $87,200 |
| 2015 | $3,073 | $158,100 | $75,800 | $82,300 |
| 2014 | $2,697 | $142,800 | $64,400 | $78,400 |
Source: Public Records
Map
Nearby Homes