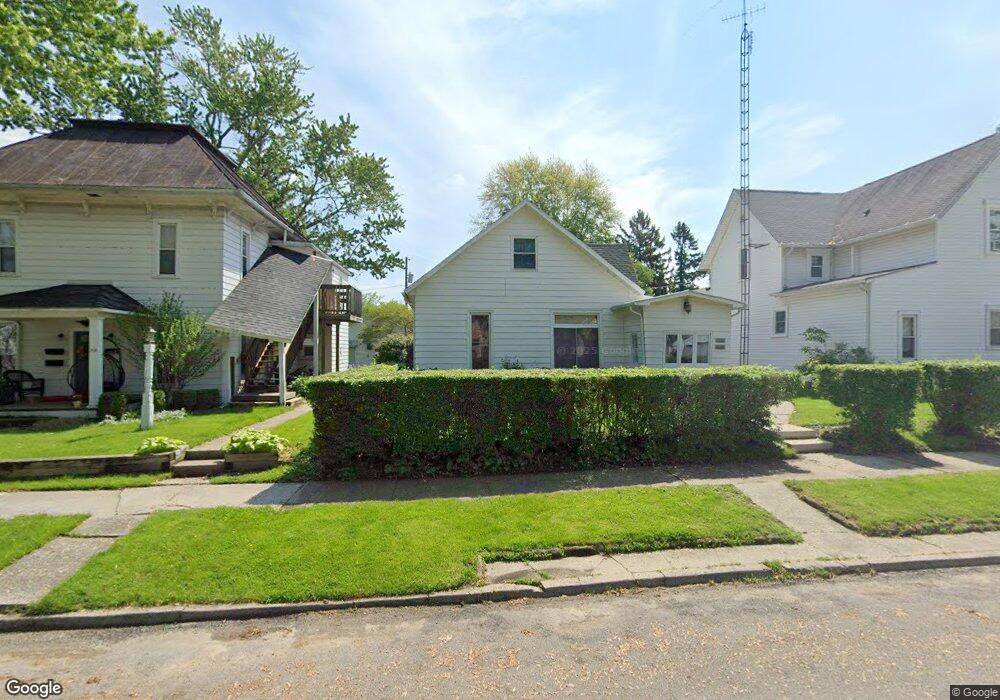
213 Main St Defiance, OH 43512
Estimated Value: $133,000 - $154,000
3
Beds
2
Baths
1,584
Sq Ft
$89/Sq Ft
Est. Value
About This Home
This home is located at 213 Main St, Defiance, OH 43512 and is currently estimated at $140,748, approximately $88 per square foot. 213 Main St is a home located in Defiance County with nearby schools including Defiance Elementary School, Defiance Middle School, and Defiance High School.
Ownership History
Date
Name
Owned For
Owner Type
Purchase Details
Closed on
Mar 23, 2007
Sold by
Karznow Pete and Karznow Bonnie
Bought by
Boldman Timothy and Boldman Kristin A
Current Estimated Value
Home Financials for this Owner
Home Financials are based on the most recent Mortgage that was taken out on this home.
Original Mortgage
$81,500
Outstanding Balance
$49,358
Interest Rate
6.27%
Mortgage Type
Unknown
Estimated Equity
$91,390
Purchase Details
Closed on
Sep 19, 2006
Sold by
Mortgage Lenders Network Usa Inc
Bought by
Karzynow Pete
Home Financials for this Owner
Home Financials are based on the most recent Mortgage that was taken out on this home.
Original Mortgage
$47,610
Interest Rate
6.58%
Mortgage Type
New Conventional
Purchase Details
Closed on
Jan 1, 1992
Bought by
Boldman Timothy and Boldman Kristin A
Create a Home Valuation Report for This Property
The Home Valuation Report is an in-depth analysis detailing your home's value as well as a comparison with similar homes in the area
Home Values in the Area
Average Home Value in this Area
Purchase History
| Date | Buyer | Sale Price | Title Company |
|---|---|---|---|
| Boldman Timothy | $61,125 | -- | |
| Karzynow Pete | $39,675 | None Available | |
| Boldman Timothy | -- | -- |
Source: Public Records
Mortgage History
| Date | Status | Borrower | Loan Amount |
|---|---|---|---|
| Open | Boldman Timothy | $81,500 | |
| Previous Owner | Karzynow Pete | $47,610 |
Source: Public Records
Tax History Compared to Growth
Tax History
| Year | Tax Paid | Tax Assessment Tax Assessment Total Assessment is a certain percentage of the fair market value that is determined by local assessors to be the total taxable value of land and additions on the property. | Land | Improvement |
|---|---|---|---|---|
| 2024 | $1,522 | $40,510 | $2,950 | $37,560 |
| 2023 | $1,522 | $40,510 | $2,950 | $37,560 |
| 2022 | $1,319 | $31,350 | $2,950 | $28,400 |
| 2021 | $1,319 | $31,350 | $2,950 | $28,400 |
| 2020 | $1,329 | $31,350 | $2,950 | $28,400 |
| 2019 | $1,185 | $27,350 | $2,950 | $24,400 |
| 2018 | $1,153 | $27,350 | $2,950 | $24,400 |
| 2017 | $1,064 | $27,342 | $2,947 | $24,395 |
| 2016 | $1,054 | $24,591 | $2,898 | $21,693 |
| 2015 | $487 | $23,632 | $2,898 | $20,734 |
| 2014 | $487 | $23,632 | $2,898 | $20,734 |
| 2013 | $487 | $23,632 | $2,898 | $20,734 |
| 2012 | $487 | $23,632 | $2,898 | $20,734 |
Source: Public Records
Map
Nearby Homes