A
Seller's Agent in 2020
Andi Scifres
Bridges Realty Group, LLC
(580) 641-2143
44 Total Sales
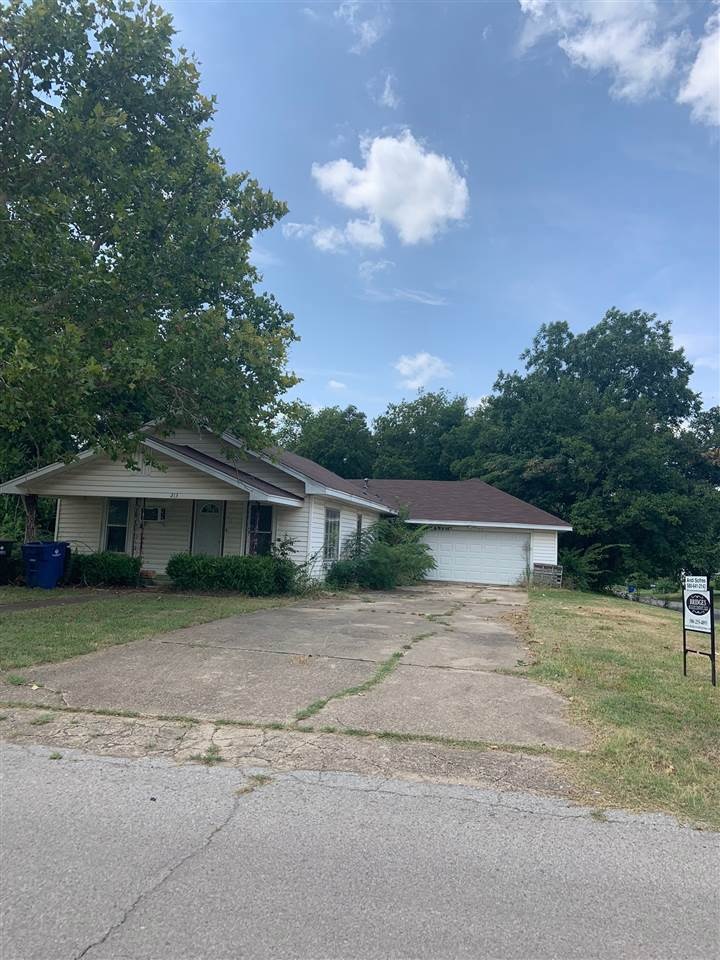

Estimated Value: $57,000 - $88,000
This home is located at 213 N 3rd St, Duncan, OK 73533 since 26 August 2019 and is currently estimated at $67,925, approximately $47 per square foot. 213 N 3rd St is a home located in Stephens County with nearby schools including Woodrow Wilson Elementary School, Duncan Middle School, and Duncan High School.
Last Agent to Sell the Property
Bridges Realty Group, LLC License #158890 Listed on: 08/26/2019
| Date | Buyer | Sale Price | Title Company |
|---|---|---|---|
| Mayfield Byron | $26,000 | Stephens County Abstract Co | |
| Moore Ronald L | -- | None Available | |
| Cherico Phyllis L | $35,000 | -- | |
| -- | -- | -- |
| Date | Event | Price | List to Sale | Price per Sq Ft |
|---|---|---|---|---|
| 04/23/2020 04/23/20 | Sold | $26,000 | -47.5% | $18 / Sq Ft |
| 03/25/2020 03/25/20 | Pending | -- | -- | -- |
| 08/26/2019 08/26/19 | For Sale | $49,500 | -- | $35 / Sq Ft |
| Year | Tax Paid | Tax Assessment Tax Assessment Total Assessment is a certain percentage of the fair market value that is determined by local assessors to be the total taxable value of land and additions on the property. | Land | Improvement |
|---|---|---|---|---|
| 2025 | $317 | $3,766 | $493 | $3,273 |
| 2024 | $291 | $3,417 | $493 | $2,924 |
| 2023 | $291 | $3,416 | $493 | $2,923 |
| 2022 | $263 | $3,099 | $493 | $2,606 |
| 2021 | $255 | $2,995 | $493 | $2,502 |
| 2020 | $339 | $3,926 | $493 | $3,433 |
| 2019 | $386 | $4,462 | $493 | $3,969 |
| 2018 | $410 | $4,603 | $493 | $4,110 |
| 2017 | $396 | $4,603 | $493 | $4,110 |
| 2016 | $400 | $4,709 | $493 | $4,216 |
| 2015 | $370 | $4,484 | $493 | $3,991 |
| 2014 | $370 | $4,271 | $495 | $3,776 |
A
Seller's Agent in 2020
Andi Scifres
Bridges Realty Group, LLC
(580) 641-2143
44 Total Sales
Source: Duncan Association of REALTORS®
MLS Number: 34535
APN: 1001-00-037-001-0-000-00
Ask me questions while you tour the home.
