Estimated Value: $163,625 - $258,000
--
Bed
1
Bath
1,636
Sq Ft
$130/Sq Ft
Est. Value
About This Home
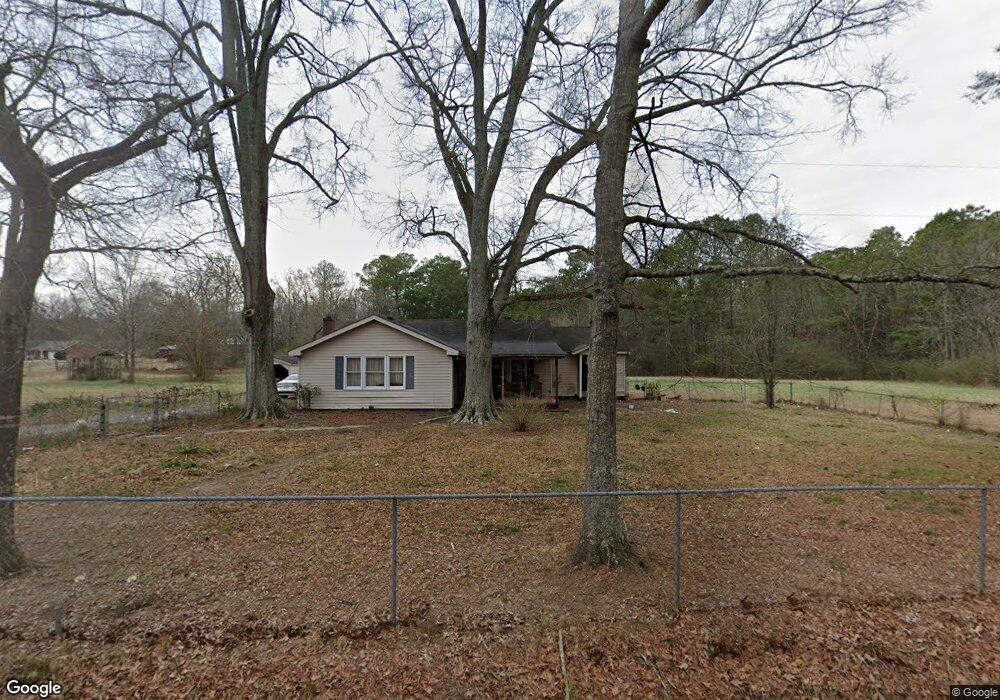
This home is located at 213 N Avery Rd NW, Rome, GA 30165 and is currently estimated at $213,406, approximately $130 per square foot. 213 N Avery Rd NW is a home located in Floyd County with nearby schools including Coosa Middle School and Coosa High School.
Ownership History
Date
Name
Owned For
Owner Type
Purchase Details
Closed on
Dec 30, 2019
Sold by
Nan Lon Ii Llc
Bought by
Ozment Floyd
Current Estimated Value
Purchase Details
Closed on
Jul 22, 2010
Sold by
Rome Kraft Employees Cr Un
Bought by
Nan Lon Inc
Purchase Details
Closed on
Jul 6, 2010
Sold by
Hardin James D
Bought by
Rome Kraft Employees Cr Un
Purchase Details
Closed on
Nov 14, 2000
Bought by
P and R
Purchase Details
Closed on
Oct 10, 1999
Sold by
Hardin Barbara Josephine
Bought by
Hardin James David
Purchase Details
Closed on
Sep 15, 1999
Bought by
P and R
Purchase Details
Closed on
Apr 15, 1990
Sold by
Hardin Barbara Josephine
Bought by
Hardin Barbara Josephine
Purchase Details
Closed on
Nov 7, 1989
Sold by
Hardin Lula Taylor and Leon Fardin
Bought by
Hardin Barbara Josephine
Purchase Details
Closed on
Jan 1, 1944
Bought by
Hardin Frank
Purchase Details
Closed on
Jun 30, 1936
Sold by
Hardin Frank
Bought by
Hardin Lula Taylor and Leon Fardin
Create a Home Valuation Report for This Property
The Home Valuation Report is an in-depth analysis detailing your home's value as well as a comparison with similar homes in the area
Home Values in the Area
Average Home Value in this Area
Purchase History
| Date | Buyer | Sale Price | Title Company |
|---|---|---|---|
| Ozment Floyd | -- | -- | |
| Nan Lon Inc | -- | -- | |
| Rome Kraft Employees Cr Un | -- | -- | |
| P | -- | -- | |
| Hardin James David | $28,000 | -- | |
| P | -- | -- | |
| P | -- | -- | |
| Hardin Barbara Josephine | -- | -- | |
| Hardin Barbara Josephine | -- | -- | |
| Hardin Frank | -- | -- | |
| Hardin Lula Taylor | -- | -- |
Source: Public Records
Tax History Compared to Growth
Tax History
| Year | Tax Paid | Tax Assessment Tax Assessment Total Assessment is a certain percentage of the fair market value that is determined by local assessors to be the total taxable value of land and additions on the property. | Land | Improvement |
|---|---|---|---|---|
| 2024 | $1,351 | $42,594 | $21,228 | $21,366 |
| 2023 | $1,219 | $39,883 | $19,298 | $20,585 |
| 2022 | $940 | $31,691 | $16,045 | $15,646 |
| 2021 | $828 | $27,444 | $14,541 | $12,903 |
| 2020 | $755 | $24,818 | $12,645 | $12,173 |
| 2019 | $723 | $24,077 | $12,645 | $11,432 |
| 2018 | $681 | $22,641 | $12,045 | $10,596 |
| 2017 | $642 | $21,311 | $11,153 | $10,158 |
| 2016 | $639 | $20,955 | $11,120 | $9,835 |
| 2015 | $625 | $20,955 | $11,120 | $9,835 |
| 2014 | $625 | $20,955 | $11,120 | $9,835 |
Source: Public Records
Map
Nearby Homes
- 45 Albert Ave NW
- 53 Northside Dr NW
- 293 N Avery Rd NW
- 86 N Avery Rd NW
- 87 Northside Dr NW
- 0 Charleston Dr NW Unit 10543945
- 0 Charleston Dr NW Unit 7598114
- 1 Ann Dr NW
- 16 Polaris Terrace NW
- 4485 Alabama Hwy
- 10 Nest Dr NW
- 48 Atwood Dr NW
- 3105 Barker Rd SW
- 3605 Garden Lakes Pkwy
- 876 Barker Rd SW
- 4813 Alabama Hwy SW
- 48 Fox Croft Rd NW
- 224 Rolling Oaks Dr NW
- 212 Rolling Oaks Dr NW
- 2890 Alabama Hwy NW
- 220 N Avery Rd NW
- 185 N Avery Rd NW
- 190 N Avery Rd NW
- 241 N Avery Rd NW
- 165 N Avery Rd NW
- 250 N Avery Rd NW
- 257 N Avery Rd NW
- 271 N Avery Rd NW
- 26 Albert Ave NW
- 166 N Avery Rd NW
- 151 N Avery Rd NW
- 151 N Avery Rd NW
- 151 N Avery Rd NW
- 151 N Avery Rd NW
- 274 N Avery Rd NW
- 134 N Avery Rd NW
- 58 Albert Ave NW
- 40 Albert Ave NW
- 133 N Avery Rd NW
- 128 N Avery Rd NW