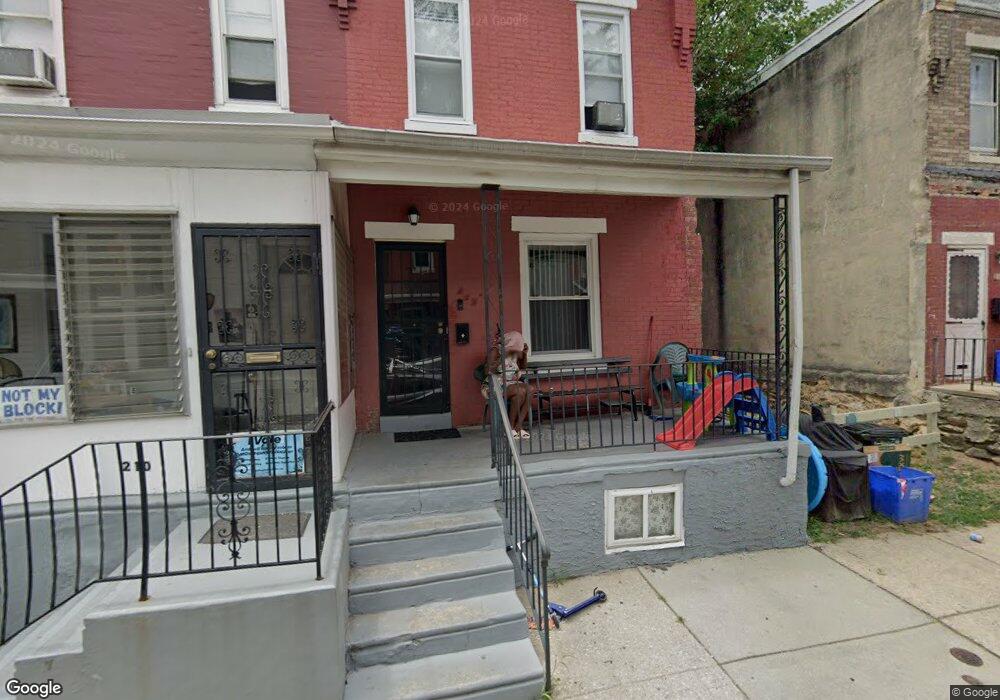
213 N Cecil St Philadelphia, PA 19139
Haddington NeighborhoodEstimated Value: $83,000 - $148,000
--
Bed
--
Bath
1,018
Sq Ft
$118/Sq Ft
Est. Value
About This Home
This home is located at 213 N Cecil St, Philadelphia, PA 19139 and is currently estimated at $119,911, approximately $117 per square foot. 213 N Cecil St is a home located in Philadelphia County with nearby schools including John Barry Elementary School, William L. Sayre High School, and Universal Bluford Charter School.
Ownership History
Date
Name
Owned For
Owner Type
Purchase Details
Closed on
Dec 16, 2004
Sold by
The Bank Of New York
Bought by
Do 2 Win R E Group Llc
Current Estimated Value
Purchase Details
Closed on
Sep 10, 2004
Sold by
Wells Fargo Bank Na
Bought by
The Bank Of New York and Eqcc Trust 2001-2
Purchase Details
Closed on
Sep 7, 2004
Sold by
Gilbert Monica
Bought by
Wells Fargo Bank Minnesota Na and Option One Mortgage Loan Trust 2001-B As
Purchase Details
Closed on
Nov 1, 2000
Sold by
First Union Natl Bank Of North Carolina
Bought by
Prout Markia
Purchase Details
Closed on
Jul 12, 1999
Sold by
Chapman William T
Bought by
First Union Natl Bank Of North Carolina
Create a Home Valuation Report for This Property
The Home Valuation Report is an in-depth analysis detailing your home's value as well as a comparison with similar homes in the area
Home Values in the Area
Average Home Value in this Area
Purchase History
| Date | Buyer | Sale Price | Title Company |
|---|---|---|---|
| Do 2 Win R E Group Llc | $24,000 | -- | |
| The Bank Of New York | $25,000 | -- | |
| Wells Fargo Bank Minnesota Na | $2,500 | -- | |
| Prout Markia | $17,000 | -- | |
| First Union Natl Bank Of North Carolina | $3,500 | -- |
Source: Public Records
Tax History Compared to Growth
Tax History
| Year | Tax Paid | Tax Assessment Tax Assessment Total Assessment is a certain percentage of the fair market value that is determined by local assessors to be the total taxable value of land and additions on the property. | Land | Improvement |
|---|---|---|---|---|
| 2025 | $854 | $92,200 | $18,440 | $73,760 |
| 2024 | $854 | $92,200 | $18,440 | $73,760 |
| 2023 | $854 | $61,000 | $12,200 | $48,800 |
| 2022 | $739 | $61,000 | $12,200 | $48,800 |
| 2021 | $739 | $0 | $0 | $0 |
| 2020 | $739 | $0 | $0 | $0 |
| 2019 | $713 | $0 | $0 | $0 |
| 2018 | $440 | $0 | $0 | $0 |
| 2017 | $440 | $0 | $0 | $0 |
| 2016 | $440 | $0 | $0 | $0 |
| 2015 | $421 | $0 | $0 | $0 |
| 2014 | -- | $31,400 | $3,353 | $28,047 |
| 2012 | -- | $5,152 | $1,099 | $4,053 |
Source: Public Records
Map
Nearby Homes