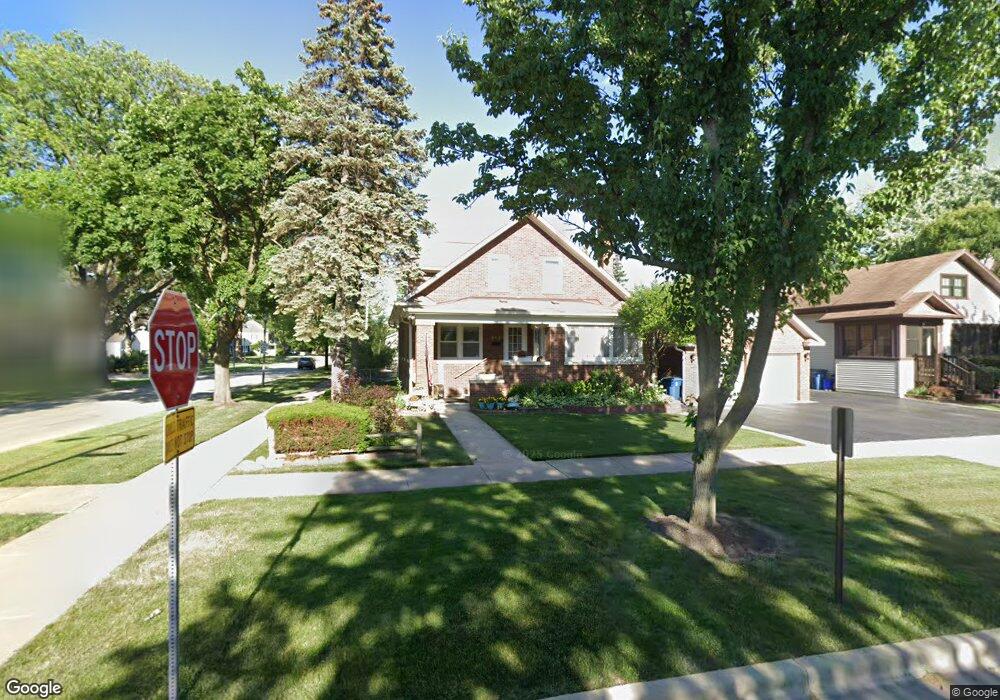
213 N Evergreen Ave Elmhurst, IL 60126
Estimated Value: $871,406 - $1,049,000
--
Bed
--
Bath
2,786
Sq Ft
$342/Sq Ft
Est. Value
About This Home
This home is located at 213 N Evergreen Ave, Elmhurst, IL 60126 and is currently estimated at $952,102, approximately $341 per square foot. 213 N Evergreen Ave is a home located in DuPage County with nearby schools including Reinberg Elementary School, Ruggles Elementary School, and Hawthorne Elementary School.
Ownership History
Date
Name
Owned For
Owner Type
Purchase Details
Closed on
Oct 16, 2001
Sold by
Fifth Third Bank
Bought by
Berryman Ricky D and Berryman Lynn T
Current Estimated Value
Home Financials for this Owner
Home Financials are based on the most recent Mortgage that was taken out on this home.
Original Mortgage
$129,600
Interest Rate
6.6%
Purchase Details
Closed on
Aug 24, 2000
Sold by
Martin Thomas J and Martin Jean E
Bought by
Old Kent Bank and Trust #Ok13094
Home Financials for this Owner
Home Financials are based on the most recent Mortgage that was taken out on this home.
Original Mortgage
$130,000
Interest Rate
8.05%
Mortgage Type
Purchase Money Mortgage
Create a Home Valuation Report for This Property
The Home Valuation Report is an in-depth analysis detailing your home's value as well as a comparison with similar homes in the area
Home Values in the Area
Average Home Value in this Area
Purchase History
| Date | Buyer | Sale Price | Title Company |
|---|---|---|---|
| Berryman Ricky D | -- | First American Title | |
| Old Kent Bank | $358,000 | -- |
Source: Public Records
Mortgage History
| Date | Status | Borrower | Loan Amount |
|---|---|---|---|
| Previous Owner | Berryman Ricky D | $129,600 | |
| Previous Owner | Old Kent Bank | $130,000 |
Source: Public Records
Tax History Compared to Growth
Tax History
| Year | Tax Paid | Tax Assessment Tax Assessment Total Assessment is a certain percentage of the fair market value that is determined by local assessors to be the total taxable value of land and additions on the property. | Land | Improvement |
|---|---|---|---|---|
| 2024 | $14,257 | $252,561 | $128,276 | $124,285 |
| 2023 | $13,207 | $233,550 | $118,620 | $114,930 |
| 2022 | $13,251 | $224,520 | $114,040 | $110,480 |
| 2021 | $12,925 | $218,930 | $111,200 | $107,730 |
| 2020 | $12,427 | $214,130 | $108,760 | $105,370 |
| 2019 | $12,170 | $203,580 | $103,400 | $100,180 |
| 2018 | $12,043 | $200,400 | $97,900 | $102,500 |
| 2017 | $11,785 | $190,960 | $93,290 | $97,670 |
| 2016 | $11,543 | $179,890 | $87,880 | $92,010 |
| 2015 | $11,437 | $167,590 | $81,870 | $85,720 |
| 2014 | $11,055 | $149,450 | $65,790 | $83,660 |
| 2013 | $10,934 | $151,560 | $66,720 | $84,840 |
Source: Public Records
Map
Nearby Homes
- 193 N Elm Ave
- 196 N Walnut St
- 314 N Elm Ave
- 104 Evergreen Ave
- 210 N Addison Ave Unit 202
- 254 N Addison Ave
- 258 N Addison Ave
- 262 N Addison Ave
- 260 N Addison Ave
- 120 N Walnut St
- 195 N Addison Ave Unit PH03
- 284 N Highland Ave
- 355 W 1st St
- 285 N Ridgeland Ave
- 407 W North Ave
- 322 N Highland Ave
- 131 W Adelaide St Unit 309
- 145 S York St Unit 404
- 145 S York St Unit 322
- 456 N Elm Ave
- 209 N Evergreen Ave
- 205 N Evergreen Ave
- 225 N Evergreen Ave
- 201 N Evergreen Ave
- 208 N Evergreen Ave
- 210 N Evergreen Ave
- 229 N Evergreen Ave
- 204 N Evergreen Ave
- 210 N Elm Ave
- 204 N Elm Ave
- 200 N Elm Ave
- 200 N Evergreen Ave
- 222 N Evergreen Ave
- 233 N Evergreen Ave
- 222 N Elm Ave
- 226 N Evergreen Ave
- 194 N Elm Ave
- 196 N Evergreen Ave
- 226 N Elm Ave
- 237 N Evergreen Ave