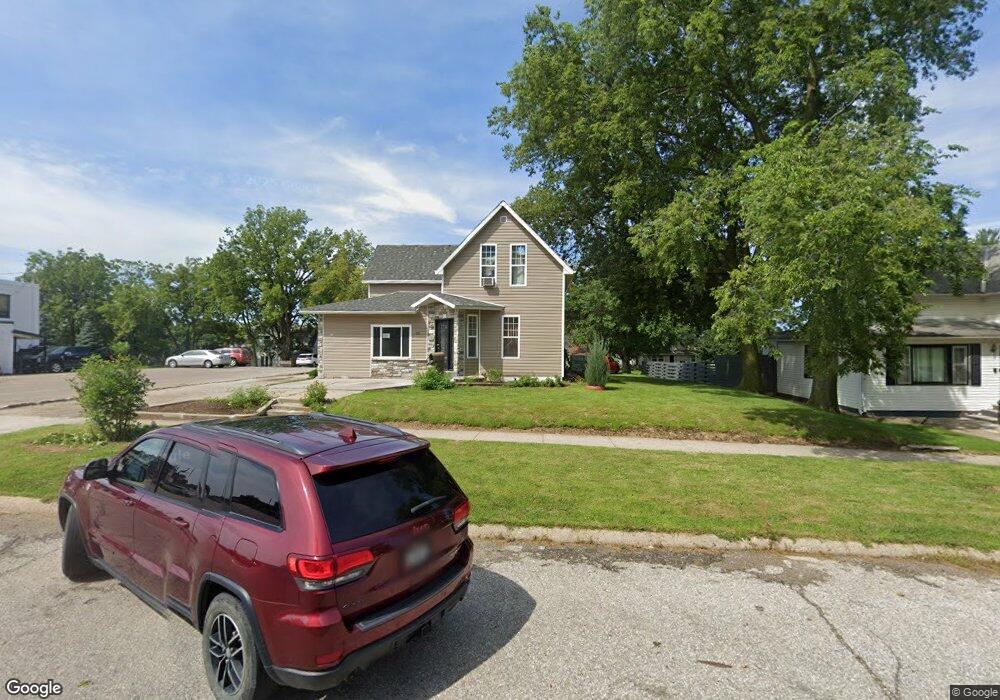
213 N Main St Denison, IA 51442
Estimated Value: $129,000 - $178,000
3
Beds
2
Baths
1,445
Sq Ft
$102/Sq Ft
Est. Value
About This Home
This home is located at 213 N Main St, Denison, IA 51442 and is currently estimated at $147,237, approximately $101 per square foot. 213 N Main St is a home with nearby schools including Denison Elementary School, Broadway Elementary School, and Denison Middle School.
Ownership History
Date
Name
Owned For
Owner Type
Purchase Details
Closed on
Dec 18, 2012
Sold by
Navar Luis and Navar Guadalupe
Bought by
Barrios Juana
Current Estimated Value
Home Financials for this Owner
Home Financials are based on the most recent Mortgage that was taken out on this home.
Original Mortgage
$44,000
Interest Rate
3.34%
Mortgage Type
New Conventional
Purchase Details
Closed on
Mar 30, 2010
Sold by
Acosta Jose S and Acosta Socorro Mora
Bought by
Navar Luis and Navar Guadalupe
Home Financials for this Owner
Home Financials are based on the most recent Mortgage that was taken out on this home.
Original Mortgage
$57,099
Interest Rate
4.96%
Mortgage Type
Commercial
Create a Home Valuation Report for This Property
The Home Valuation Report is an in-depth analysis detailing your home's value as well as a comparison with similar homes in the area
Home Values in the Area
Average Home Value in this Area
Purchase History
| Date | Buyer | Sale Price | Title Company |
|---|---|---|---|
| Barrios Juana | $43,000 | None Available | |
| Navar Luis | $45,000 | None Available |
Source: Public Records
Mortgage History
| Date | Status | Borrower | Loan Amount |
|---|---|---|---|
| Closed | Barrios Juana | $44,000 | |
| Previous Owner | Navar Luis | $57,099 |
Source: Public Records
Tax History
| Year | Tax Paid | Tax Assessment Tax Assessment Total Assessment is a certain percentage of the fair market value that is determined by local assessors to be the total taxable value of land and additions on the property. | Land | Improvement |
|---|---|---|---|---|
| 2025 | $1,980 | $129,430 | $14,060 | $115,370 |
| 2024 | $1,980 | $107,490 | $14,060 | $93,430 |
| 2023 | $1,208 | $107,490 | $14,060 | $93,430 |
| 2022 | $1,142 | $56,000 | $9,840 | $46,160 |
| 2021 | $1,016 | $53,380 | $9,840 | $43,540 |
| 2020 | $1,004 | $44,350 | $9,840 | $34,510 |
| 2019 | $974 | $41,390 | $9,840 | $31,550 |
| 2018 | $954 | $41,390 | $9,840 | $31,550 |
| 2017 | $984 | $41,390 | $9,840 | $31,550 |
| 2016 | $954 | $41,670 | $0 | $0 |
| 2015 | $954 | $41,690 | $0 | $0 |
| 2014 | $942 | $42,370 | $0 | $0 |
Source: Public Records
Map
Nearby Homes
Your Personal Tour Guide
Ask me questions while you tour the home.