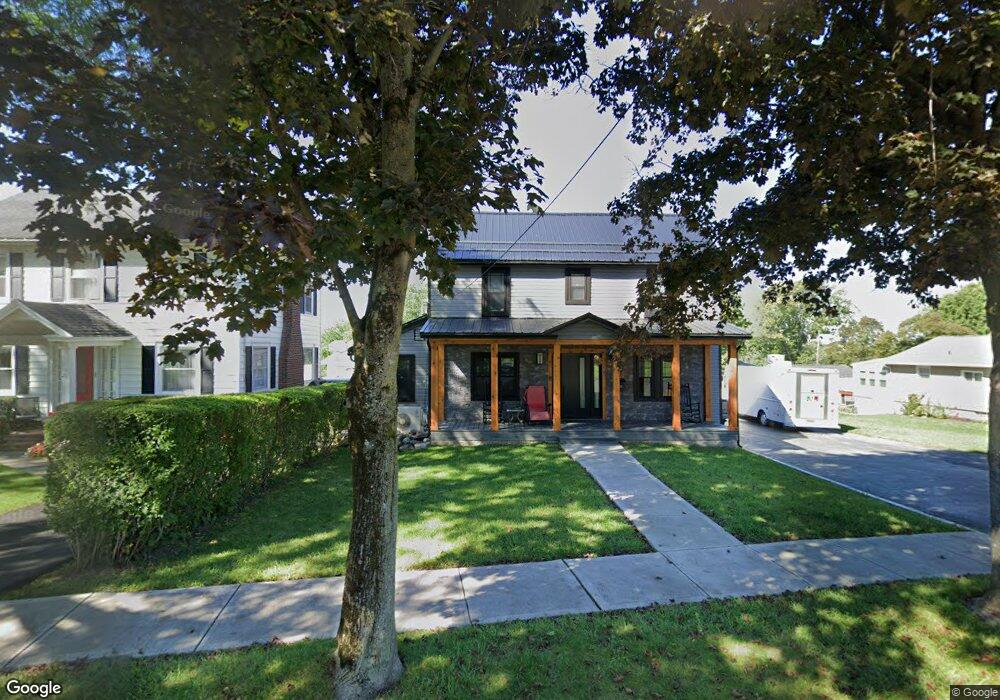
213 N Marvine Ave Auburn, NY 13021
Estimated Value: $294,000 - $449,000
4
Beds
3
Baths
2,408
Sq Ft
$158/Sq Ft
Est. Value
About This Home
This home is located at 213 N Marvine Ave, Auburn, NY 13021 and is currently estimated at $379,768, approximately $157 per square foot. 213 N Marvine Ave is a home located in Cayuga County with nearby schools including Auburn Junior High School, Auburn High School, and St. Joseph School.
Ownership History
Date
Name
Owned For
Owner Type
Purchase Details
Closed on
Aug 9, 2024
Sold by
Villano Joseph G
Bought by
Villano Joseph G and Villano Kelley M
Current Estimated Value
Purchase Details
Closed on
Dec 8, 2006
Sold by
Fagan Edward
Bought by
Villano Joseph
Home Financials for this Owner
Home Financials are based on the most recent Mortgage that was taken out on this home.
Original Mortgage
$183,350
Interest Rate
6.4%
Mortgage Type
New Conventional
Purchase Details
Closed on
Sep 27, 2002
Sold by
Bulla Rosemary Stephenson
Bought by
Fagan Edward P
Purchase Details
Closed on
Apr 16, 2002
Sold by
Lee Jeffrey W
Bought by
Bulla Rosemary Stephenson
Purchase Details
Closed on
Jan 31, 2002
Sold by
Maher Kevin P
Bought by
Lee Jeffrey W
Purchase Details
Closed on
Jun 30, 1995
Sold by
Donovan Michael P Donovan Kare
Bought by
Maher Kevin P and Maher Karen A
Create a Home Valuation Report for This Property
The Home Valuation Report is an in-depth analysis detailing your home's value as well as a comparison with similar homes in the area
Home Values in the Area
Average Home Value in this Area
Purchase History
| Date | Buyer | Sale Price | Title Company |
|---|---|---|---|
| Villano Joseph G | -- | None Listed On Document | |
| Villano Joseph | $193,000 | James Leone | |
| Fagan Edward P | $126,000 | Howard Clark | |
| Bulla Rosemary Stephenson | -- | Norman J Chirco | |
| Lee Jeffrey W | $130,000 | Norman Chirco | |
| Maher Kevin P | $115,000 | -- |
Source: Public Records
Mortgage History
| Date | Status | Borrower | Loan Amount |
|---|---|---|---|
| Previous Owner | Villano Joseph | $183,350 |
Source: Public Records
Tax History Compared to Growth
Tax History
| Year | Tax Paid | Tax Assessment Tax Assessment Total Assessment is a certain percentage of the fair market value that is determined by local assessors to be the total taxable value of land and additions on the property. | Land | Improvement |
|---|---|---|---|---|
| 2024 | $6,781 | $294,300 | $30,000 | $264,300 |
| 2023 | $6,588 | $282,900 | $30,000 | $252,900 |
| 2022 | $6,094 | $282,900 | $30,000 | $252,900 |
| 2021 | $5,489 | $220,600 | $30,000 | $190,600 |
| 2020 | $5,354 | $220,600 | $30,000 | $190,600 |
| 2019 | $1,815 | $213,500 | $30,000 | $183,500 |
| 2018 | $5,093 | $213,500 | $30,000 | $183,500 |
| 2017 | $5,142 | $208,200 | $30,000 | $178,200 |
| 2016 | $6,156 | $208,200 | $30,000 | $178,200 |
| 2015 | $2,954 | $208,200 | $30,000 | $178,200 |
| 2014 | $2,954 | $208,200 | $30,000 | $178,200 |
Source: Public Records
Map
Nearby Homes
- 48 Drummond St
- 121 Capitol Street Extension
- 226 N Hoopes Ave
- 318 N Seward Ave
- 439 N Seward Ave Unit 441
- 445 N Seward Ave
- 244 E Genesee St
- 1 Alden Ave
- 212 N Seward Ave
- 10 Alden Ave
- 44 Capitol St
- 144 E Genesee St
- 11 Adams St
- 133 E Genesee St
- 9 Cayuga St
- 160 S Seward Ave
- 98 Franklin St
- 55 Vitale Dr
- 6 Brister Ave
- 6661 Butera Dr
- 211 N Marvine Ave
- 28 Charles St
- 209 N Marvine Ave
- 24 Charles St
- 29 Drummond St
- 25 Drummond St
- 216 N Marvine Ave
- 218 N Marvine Ave
- 301 N Marvine Ave
- 20 Charles St
- 214 N Marvine Ave
- 207 N Marvine Ave
- 302 N Marvine Ave
- 21 Charles St
- 23 Drummond St
- 16 Charles St
- 208 N Marvine Ave
- 305 N Marvine Ave
- 304 N Marvine Ave
- 36 Charles St